
EUR/USD. Overview for September 7. Non-Farm Payrolls Passed the Market By. Why?
07.09.2026
The EUR/USD currency pair showed slightly higher volatility on Friday than earlier in the week. However, look at the volatility chart: Thursday moved 47 pips, Wednesday 43 pips, and Friday, with its Nonfarm Payrolls and unemployment, 58 pips. So calling Friday highly volatile is an overstatement. What does this tell us? Only that traders formally processed the Nonfarm Payrolls report, showing that it does not currently determine the dollar's fate.
What did Nonfarms show? In August, 162,000 jobs were created, and the previous two months were revised up. One might think the path to a stronger dollar is open. But it's not so simple. The market filters every report through the prism of Federal Reserve monetary policy. We keep repeating: given current conditions, the odds of Fed tightening are very low. This is supported by the frankly neutral stance of many FOMC members, slowing inflation in recent months, and the figure of Kevin Warsh, who is known as a Trump protege.
Donald Trump constantly demands lower rates. We are convinced that when Warsh was appointed Fed Chair, there was an understanding that monetary policy would be adjusted to the White House's preferences. It remains to be seen whether a suitable moment can be found to avoid casting a shadow on Warsh himself and to preserve public trust in the central bank. It seems the time for rate cuts has not come, but a rate hike is politically difficult for Trump or Warsh. Thus we still believe the rate will not be raised under almost any circumstances.
How does Nonfarm fit into this? It complicates Warsh's task: if the labor market is recovering, attention must focus on inflation, which still significantly exceeds the target. But look at Nonfarm data for the whole of 2026, not a single month. The labor market remains sluggish and only occasionally posts decent numbers. There is no guarantee that August's 162k won't fall to 100k or less in October, nor that September will produce strong payrolls. Therefore, we cannot say the labor market has recovered. If so, a strong Nonfarm print does not change the Fed's policy outlook, at least for September. That is why demand for the US currency did not increase, and next week US inflation prints — also critical for the Fed — will be released.
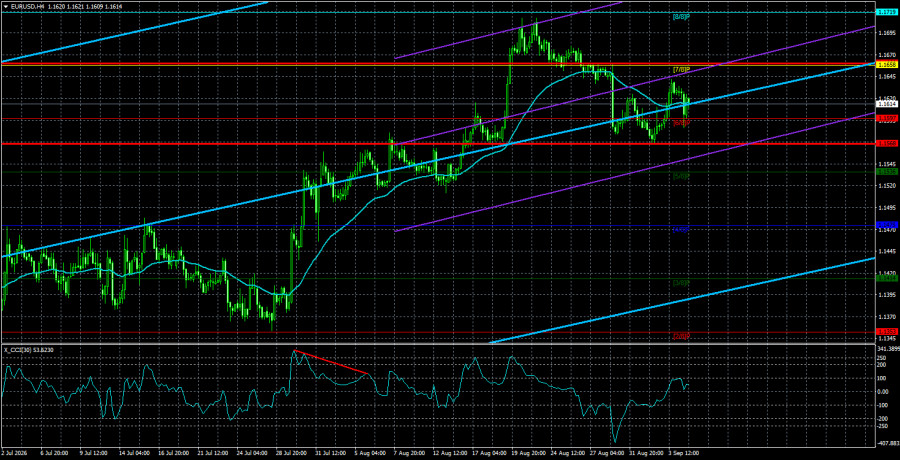
Average volatility of the EUR/USD pair over the last 5 trading days as of September 7 is 46 pips, characterized as "mid-low." We expect the pair to move between 1.1568 and 1.1660 on Monday. The major linear regression channel has turned up, indicating an upward trend. The CCI indicator entered oversold territory, warning of a possible end to the correction.
Nearest support levels:
S1 – 1.1597
S2 – 1.1536
S3 – 1.1475
Nearest resistance levels:
R1 – 1.1658
R2 – 1.1719
R3 – 1.1780
Trading recommendations:
The EUR/USD pair continues its upward trend on the 4-hour TF, which may mark the start of a new leg of a global uptrend on higher TFs. The global fundamental backdrop for the dollar remains negative, although in 2026 geopolitics and then a hawkish Fed stance provided strong support for the US currency. Those factors no longer support the dollar now. If price is below the moving average, consider short positions on corrective grounds with targets at 1.1568 and 1.1536. Above the moving average, long positions remain relevant with targets at 1.1658 and 1.1719.
Explanations for the illustrations:
- Linear regression channels help identify the current trend. If both are aligned, the trend is strong.
- The moving average line (settings: 20, 0, smoothed) defines the short-term trend and the direction to trade.
- Murray levels are target levels for moves and corrections.
- Volatility levels (red lines) indicate the likely price channel for the next day based on current volatility.
- The CCI indicator entering oversold territory (below -250) or overbought territory (above +250) signals an approaching trend reversal.
EUR/USD. A Hot September Week: ECB Meeting and US CPI/PPI
07.09.2026
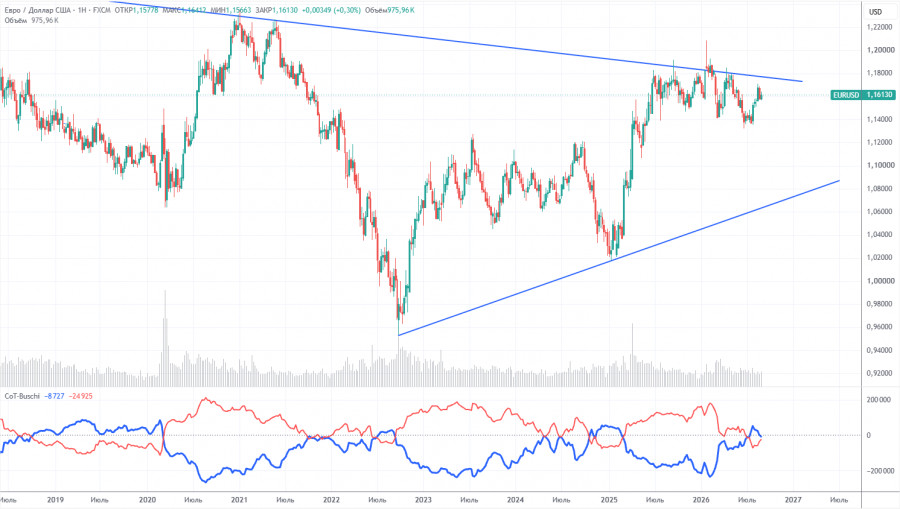
Friday's Nonfarm Payrolls sounded a loud chord, finalizing the past week. However, despite the report's resonance and importance, it failed to impose a clear directional bias for EUR/USD. The pair closed Friday at 1.1614, so, formally, the week ended in buyers' favor, since the W1 opening price stood at 1.1581.
From a technical standpoint, the pair ended the week at a crossroads — on the middle line of the Bollinger Bands on the D1 timeframe and between the Tenkan-sen and Kijun-sen lines. If the balance shifts to the north, price will sit between the middle and upper Bollinger Bands and Ichimoku will form a bullish "Parade of Lines" signal. In that case, the 1.17 area could come into view. Otherwise, the pair may remain within the 1.15 range with a target toward 1.1510 (the lower Bollinger Band coinciding with the upper Kumo boundary on D1).

The key drivers of EUR/USD price action next week are US CPI/PPI prints and the September European Central Bank meeting — in other words, the degree of decoupling between Federal Reserve and ECB rates and the corresponding monetary expectations.
CPI/PPI
The main reason the dollar reacted weakly to strong Nonfarm Payrolls is that the market received two dovish signals at once.
First, Fed Governor Christopher Waller said he is inclined to support holding the current rate at the September meeting if the inflation picture continues to improve.
Second, Donald Trump publicly demanded that the Fed lower borrowing costs. This is not his first such call, but it is the first made while Kevin Warsh is chair. Warsh's predecessor, Jerome Powell, once withstood White House pressure despite having initiated legal action (which was later dropped). Whether the current Fed chair will withstand similar pressure is an open question — especially since Warsh himself took a fairly hawkish stance on inflation in his recent Jackson Hole remarks.
In this context, CPI and PPI can serve as the catalyst that the labor market data lacked. Consensus expects US consumer prices to accelerate in August to roughly +0.4% month-on-month (from +0.1%), with the annual rate holding near 3.4%. Core CPI is expected to remain at July's monthly rate of +0.2% and to tick down slightly year-on-year (from 2.5% to 2.4%).
For PPI, the market is preparing for acceleration: the producer price index is forecast to rise about 0.4% m/m and to about 4.9% y/y (some estimates even point to ~5.1%). This scenario looks logical given the oil factor. In July, it barely showed up in inflation data: energy in the CPI even fell (-1.5%), and July PPI was flat. However, much of PPI data is collected early in the month, so the sharp summer spike in oil prices did not make it into July's report. August data should capture the summer energy impulse.
If CPI/PPI prints come in the "green zone," hawks' positions will be substantially reinforced — especially against the backdrop of Warsh's tough Jackson Hole rhetoric. Even Christopher Waller, while currently prepared to wait, warned he would support rate hikes if inflation accelerates again.
If inflation prints land in the "red zone," the dollar will face significant pressure (also due to Waller's and Trump's rhetoric) — in that case EUR/USD buyers would likely return to the 1.1640–1.1680 range with prospects of testing the 1.17 area.
Note that due to Labor Day in the US, federal offices and the Bureau of Labor Statistics will be closed on Monday (September 7), so the workweek begins Tuesday and inflation releases shift by one day — PPI will be released on Thursday (September 10) and CPI on Friday (September 11).
ECB
The second key story of the week is the ECB meeting on Thursday, September 10. A 25 bp rate hike is already almost fully priced in — that is the baseline scenario. Market focus will therefore be on the accompanying statement and Christine Lagarde's rhetoric.
Recent inflation releases leave more questions than answers. In Germany, consumer inflation accelerated in August to 2.9% y/y from 2.8% in July, while core inflation held at 2.4%. In the eurozone, preliminary HICP estimates show acceleration to 3.3% y/y (from 2.9%), with the energy component jumping to 14.3%. At the same time, core inflation slowed to 2.4%.
Thus, the energy shock so far is reflected in headline inflation but has not translated into a sustained rise in core prices — the "secondary effect" is not yet visible. The ECB could therefore deliver a "dovish hike." If Lagarde stresses the temporary nature of the energy spike and adopts cautious rhetoric about further tightening, the euro will come under considerable pressure despite a rate increase. But if she signals that September's hike is not the last, the single currency (and EUR/USD) will gain additional fundamental support.
Conclusion
Next week can be pivotal. CPI/PPI data will shape expectations about Fed policy, while the ECB meeting will test the persistence of inflationary pressures in the eurozone. The combination of these two factors could finally lift EUR/USD out of its prolonged sideways range.
The material has been provided by InstaForex Company - www.instaforex.comEUR/USD Analysis – September 4: Is Market Confidence in the Fed Weakening Again?
04.09.2026
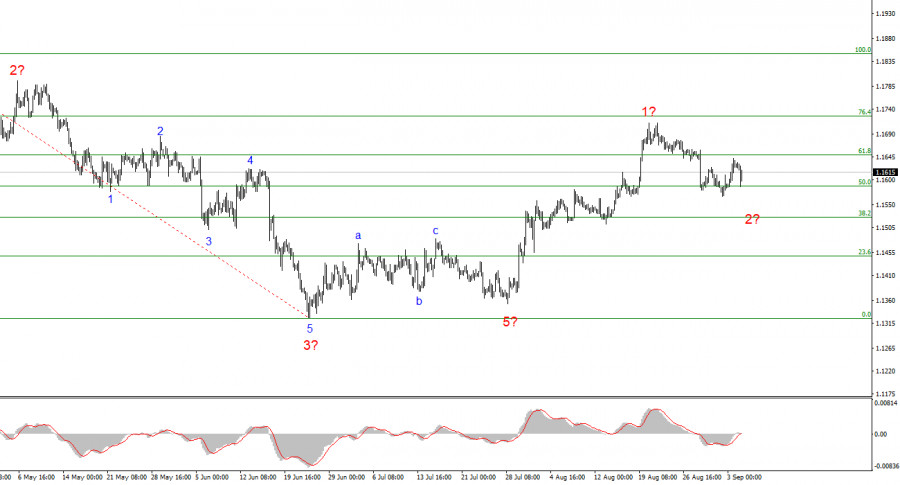
The wave pattern on the four-hour chart for EUR/USD is becoming more complex. There is still no question of canceling the upward section of the trend (lower chart), which began in January of last year. On the contrary, we saw a complete A-B-C corrective structure, which has most likely been completed. We never saw a convincing wave 5 in C. This wave took a truncated form, which also happens from time to time. Let me remind you that classical wave structures are generally found only in textbooks. In real-life market conditions, traders and analysts should be more flexible in their analysis.
Unfortunately, the wave structure may become more complex again at present. Wave C may take a three-wave form, the wave that follows it will be identified as wave D, and the entire trend section that began on January 27 will take the five-wave corrective form A-B-C-D-E. If this assumption is correct, wave D will take a three-wave form, and on August 21, EUR/USD entered the phase of forming wave E, whose low should be below the low of wave C at 1.1325. At the same time, however, this scenario is an alternative one. Based on the fundamental backdrop, I am more inclined to expect the formation of a global upward wave.
The EUR/USD pair declined by 10 basis points during Friday's trading session. Of course, by the end of the day, the exchange-rate change may turn out to be much greater than the current figure. However, the absolute change in the EUR/USD rate is not the key factor today; rather, the intraday price movements are more important. In short, the US currency managed to gain approximately 35 points after the release of an exceptionally strong Nonfarm Payrolls report. This increase was relatively small given the strength of the report. The Nonfarm Payrolls report showed a figure that market participants had been waiting for for at least four months. In August, 162,000 jobs were created, exceeding market expectations by at least three times. The unemployment rate did not deteriorate and remained unchanged at 4.1%. Accordingly, the US currency had an excellent opportunity to strengthen its position following its gains in recent weeks, but it failed to take advantage of it. Why?
In my view, the answer is straightforward and particularly clear, just like today's payrolls report. Despite the strong August figure, the overall state of the US labor market in 2025 and 2026 remains unsatisfactory. Over the past 17 months, we have seen a Nonfarm Payrolls figure above 100,000 only five times. Let me remind you that during Joe Biden's presidency, at least 100,000 jobs were created every month, and usually considerably more. Therefore, the August payrolls figure is an exception rather than the rule. The US labor market remains in a "cooled" state, so in my view, the Fed is unlikely to risk raising the interest rate in September. This explains the lack of a strong strengthening of the US currency today. The market once again does not believe that the FOMC will tighten policy.
Overall Conclusions.
Based on my EUR/USD analysis, I conclude that the pair remains within a local upward section of the trend as part of the first wave of a new global upward section. It should be acknowledged that the trend section that began in January of this year may take the form of A-B-C-D-E. If this assumption is correct, the decline in quotations will resume, with targets below the low of wave C at 1.1325. However, I consider this scenario to be an alternative one. I believe that a new upward section of the trend began forming in June, which will return the euro currency to the 20th level and take it significantly above this level.
On the higher time frame, an upward section of the trend is visible, followed by the formation of an A-B-C corrective structure. This structure may take a five-wave form, but at the current time I consider it complete. If so, the formation of a new impulsive upward section of the trend has begun.
Main Principles of My Analysis:
- Wave structures should be simple and easy to understand. Complex structures are difficult to trade and often involve changes.
- If there is no certainty about what is happening in the market, it is better not to enter the market.
- There can never be 100% certainty about the direction of a price movement. Do not forget to use protective Stop Loss orders.
- Wave analysis can be combined with other types of analysis and trading strategies.
EUR/USD – Smart Money Analysis: An Unexpected Development
04.09.2026
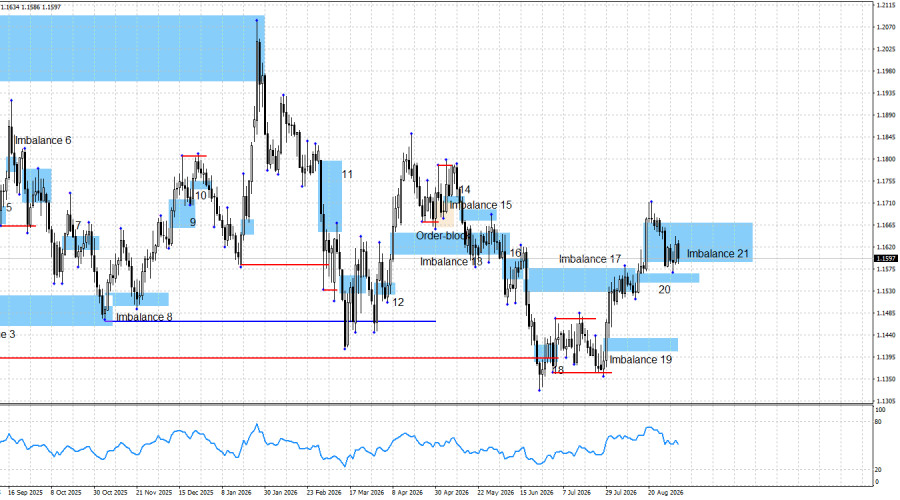
The EUR/USD pair had been declining for six days, but the bears' advance has now come to an end. For five full days, the US dollar has been unable to convince traders that further purchases of the currency are justified. Imbalance 21 has not been invalidated, while imbalance 20 triggered a price reaction. The Nonfarm Payrolls report released today somewhat spoiled the picture for the bulls. Following a series of weak reports on the labor market and business activity, it showed a genuinely strong result. In August, 162,000 new jobs were created, while traders had not expected more than 56,000. It does not matter that this figure may be revised in a month. What matters is that today the previous month's figure was revised from -29,000 to +21,000. Thus, the Nonfarm Payrolls report should have triggered a very strong rise in the US currency. This is not only because the labor market itself finally showed a positive result, but also because the chances of FOMC monetary policy tightening have now increased. Of course, I do not want to draw conclusions about the state of the labor market based on a single monthly report, but nevertheless, ahead of the September meeting, this is a good argument in favor of a rate hike. However, I still believe that the Fed will not take a hawkish step in September, and the dollar did not rise today by an amount commensurate with the payrolls report and the prospect of future monetary policy tightening.
Overall, in my view, the fundamental backdrop continues to fully support the bulls. First, it is clearly visible on any chart that the euro currency began its rise from relatively low levels, compared with its average price over the past year. This means that it still has upward potential. Second, the market continues to doubt that the FOMC will tighten monetary policy in September, regardless of what Worsh says. Third, economic data from the United States have recently brought nothing but disappointment. Fourth, geopolitics no longer supports the bears or the dollar. Fifth, the ECB may tighten monetary policy once more this autumn. Sixth, the US Treasury has decided to increase its purchases of long-term bonds, which reduces demand for the dollar. Seventh, a new trade war between the United States and Canada and between the United States and China may begin in the near future. Eighth, the US labor market is contracting, which could put an end to Worsh's hawkish initiatives. Therefore, I currently see no reason whatsoever for a bearish advance.
US labor market data have shown weak readings over the past 4–6 months, inflation has slowed over the past two months, and GDP growth has decelerated over the past three quarters. These three factors make me doubt that the FOMC will raise rates not only in September but also by the end of the year. In my view, the bears' only opportunity at present lies in a new escalation in the Middle East, rather than in isolated reports.
The current technical picture indicates that the bullish momentum is being maintained. Price has completely filled the latest bullish imbalance 21 and even touched the previous bullish imbalance 20. The combined reaction to these two patterns could bring the bulls back into the market, and the upward move could resume. The bears will gain technical grounds for an advance only if both patterns are invalidated. The euro currency also has to save the pound, which does not have such a strong support zone.
The economic backdrop on Friday allowed the bears to launch a powerful attack. However, as of the time of writing, I can say only one thing: the reaction was extremely weak. Traders refrained from buying the US dollar, and it rose in value only nominally. Thus, it appears that the market no longer believes in FOMC policy tightening.
There are still plenty of reasons for the bulls to attack in 2026, and even the outbreak of war in the Middle East has not reduced their number. Structurally and globally, Trump's policy, which led to a significant decline in the dollar last year, has not changed. At present, I see no serious supporting factors for the US currency, despite the FOMC's formally hawkish stance. Geopolitics, which supported demand for the US currency for most of the first half of 2026, is no longer doing so. The conflict in the Middle East remains unresolved, but there have been no new hostilities from either Iran or the United States.
Economic calendar for the United States and the European Union:
- Germany – Change in industrial production (06:00 UTC).
- European Union – Change in GDP in the second quarter (09:00 UTC).
On September 7, the economic calendar contains two entries, neither of which is of particular interest. The economic backdrop may have little or no impact on market sentiment on Monday.
EUR/USD forecast and trading advice:
In my view, the pair remains in the process of forming a bullish trend that has taken a year-long pause. The fundamental backdrop changed sharply in favor of the bears six months ago, but the trend itself cannot be considered canceled or completed. In the long term, I would say that the pair is in a range. However, the range does not invalidate the broader bullish trend. Therefore, the bulls may well continue their advance after two liquidity sweeps of clearly defined lows. At present, bullish traders have an excellent support level in the form of imbalance 21, where a new bullish signal may form. We have already seen a precise rebound from imbalance 20. I consider the levels of 1.1797 and 1.1850 to be the targets for a new rise in the euro currency.
The material has been provided by InstaForex Company - www.instaforex.comUS dollar temporarily gains ground, but decisive moment to come on September 11
07.09.2026
The euro and the pound sterling plunged sharply on Friday after US nonfarm payrolls were released, but the bearish momentum had completely evaporated by today. The immediate reactions of both currencies look perfectly logical, but I wouldn't rush to declare a trend reversal, because the key event for the dollar is not the NFPs published last week but a different story this week.

US nonfarm payrolls rose by 162,000 in August versus expectations of roughly a 55,000 increase, and the unemployment rate remained at 4.1%, unchanged from the prior month, according to the Bureau of Labor Statistics. The surprise—nearly three times the forecast—was enough on its own to strengthen the dollar, benefiting the US currency and the Fed's hawkish camp while penalizing risk assets and anyone positioned for rapid policy easing.
Even more important than the report itself was the revision to previous months. July's figure was revised up by 11,000 and June's by 44,000, which turned July's -23,000 into +21,000, and left total employment for the two months some 55,000 higher than previously published. In other words, the labor-market deterioration that underpinned expectations of easing simply didn't materialize, which removes any justification for the Federal Reserve to return to a dovish stance. Inflation won't allow such a pivot, and market-implied odds of a rate hike in September have moved back up—despite the topic appearing nearly closed just two weeks ago.
Why is the market pricing in tightening when leading employment indicators point the other way? Because policymakers are not yet paying much attention to those indicators. The ISM services employment index remains in contraction territory, and the manufacturing ISM also shows falling employment—but with the official payrolls print at +162,000 those signals look secondary to the rate-setting committee. Let me remind you that the July meeting ended with the funds rate held at 3.50–3.75% on a 9–3 vote, and the dissenters were explicitly voting for a rate hike; Friday's data gave that three-member bloc the argument they had been missing. The losers in this configuration are companies in the services sector, where hiring is already compressing, and the broader economy will pay the price in the form of more expensive money.
The final act will be US inflation data on September 11, and traders will be preparing for it all week. Acceleration in consumer prices will cement a September rate hike as a done deal and give the dollar another leg higher versus the euro and the pound sterling; a slowdown would reset the committee's internal debate and quickly wipe out Friday's dollar-bull optimism. Until those figures are out, I don't expect the market to open seriously large long dollar positions, which explains the sluggishness of today's move.
The euro has its own argument, however. The ECB meets this week and is very likely to raise interest rates, supported by July's 5.8% year-on-year jump in producer prices—cost pressures of that magnitude inevitably feed through to consumer prices. That benefits euro holders via an expanding rate differential and hurts European industrial firms, which must endure both expensive energy and expensive money at the same time. So, there are plenty of reasons for the euro to attempt a recovery after Friday's sell-off.
Today's calendar doesn't undermine that case. Germany will publish industrial production for July, forecast to rise 0.1% after +0.2% in June and +0.7% in May; such dynamics would suggest German industry is gradually finding footing and could make a meaningful contribution to GDP if confirmed. The euro area will release the second estimate of Q2 GDP, expected unchanged at +0.4% quarter-on-quarter and +1.0% year-on-year, along with employment data forecast at +0.1% q/q and +0.5% y/y. Another report worthy of note is the September Sentix investor-confidence indicator (consensus 2.1), since a positive surprise there could help stabilize the single currency.
Technical analysis
EUR/USD
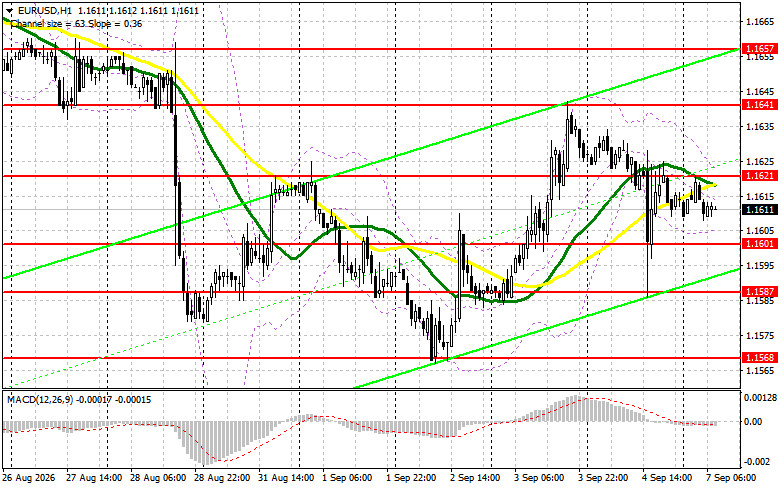
On the hourly chart, I'm looking to buy around 1.1601 and 1.1587 if there's a false breakout or a failed close below those levels. Bulls' task remains a break and hold above 1.1621; a consolidation and breakout beyond that range would open the path to 1.1641 and 1.1657, where selling into rallies for 15–20 pips would be more logical. A new high at 1.1657 would be a reason to speak of a continuing bullish trend that began on September 2. Bearish activity is likely at 1.1621 on a false breakout or at 1.1641 on a failed hold; I will only consider buying pullbacks from 1.1568, targeting the same 15–20 pips.
GBP/USD
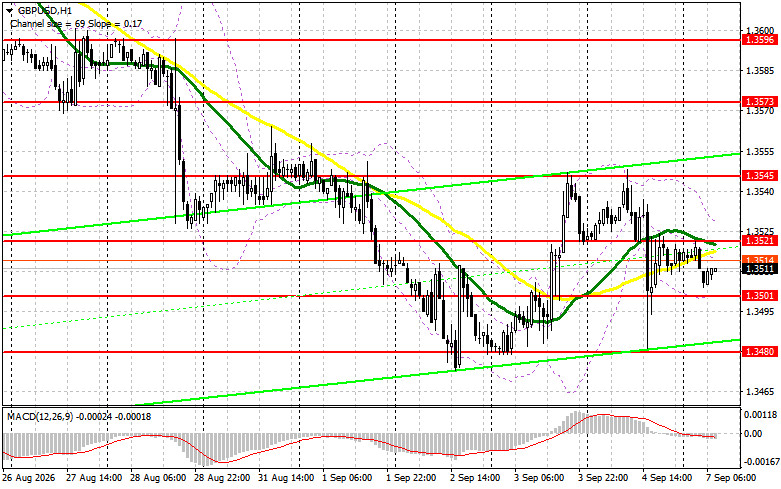
The picture is more complicated. While the euro managed a decent retracement, GBP/USD stalled at 1.3545 and remains trapped in a sideways channel with a lower boundary at 1.3480 and intermediate levels at 1.3501 and 1.3521. On rallies, a false breakout above 1.3521 would be an excuse to sell toward 1.3501; a break and hold below that level would return pressure to 1.3480 (last week's low), and a range breakdown would open the path to 1.3457, where I would expect buying into a 20–25 pip rebound. Long positions from 1.3501 and 1.3480 are justified only if those levels show false breakouts; if bears fail to overcome 1.3521, buyers can push up to 1.3545, where short positions would be triggered on a failed hold or selling into a bounce from 1.3573.
I believe the upside from Friday's dollar rally is limited. The payrolls report has already been priced in; the next decisive impulse comes on September 11. Besides, the ECB meeting this week works against the dollar in EUR/USD. Therefore, in the coming sessions, I expect EUR/USD to consolidate with attempts to climb to the upper end of the range. The pound will likely remain weaker than the euro, and pressure on GBP is likely to persist since the British currency lacks its own fundamental drivers this week.
The material has been provided by InstaForex Company - www.instaforex.comOil at $130: A New Exclusion Zone Could Cover Part of the Persian Gulf
07.09.2026
Iran and the United States exchanged the largest tanker strikes in recent times over the weekend, pushing oil prices higher. Brent rose 0.4 percent on Monday and trades near a late-July high, remaining above $97 per barrel.

Tehran said it struck three US-linked vessels that were transiting the Strait of Hormuz on unauthorized routes, in response to American strikes on Iranian tankers. US military officials earlier reported strikes on three Iranian oil tankers, one of which was destroyed, as retaliation for ballistic-missile attacks on two US Navy ships by the Islamic Revolutionary Guard Corps.
But the most telling figure in this story is not a price: according to Kpler, only one commercial vessel passed through the Strait of Hormuz on Saturday. Observed traffic remains extremely sparse, which means the strait — once carrying about one-fifth of global oil and LNG shipments — is effectively closed as a transit artery.
The causal chain from strikes to prices works directly and with little delay here. Attacks on tankers raise insurance premia and make passage economically pointless for shipowners, traffic collapses, physical shipments from the Gulf fall, and the market prices in a deficit. Winners include US shale producers and exporters outside the region, whose oil is now worth more at no extra cost, and tanker owners earning from surging freight rates. Losers are Gulf producers cut off from buyers, Asian importers and European consumers for whom pricier fuel becomes inflation.
Rhetoric from both sides indicates neither is ready to back down. Iranian parliament speaker Mohammad-Bagher Ghalibaf, who once led ceasefire talks, declared an end to the era of proportional responses: "The US must understand, before it is too late, that the rules of the game have changed," he said, adding that any aggression against Iran's interests or security will receive "a faster, heavier and more painful response." US energy secretary Chris Wright said American naval presence will continue: "This should not be the responsibility of the United States alone, but until Iran changes course or changes its government, we will have to deal with them," he said on CNN.
The market's greatest worry is an announcement by Iran's top security official, Mohsen Rezaei: he said that in the coming days a new exclusion zone outside the Strait of Hormuz will be declared, starting from the line of the US maritime blockade and extending into parts of the Persian Gulf. Geography matters here: until now, the conflict has focused on the narrow throat of the strait, while expanding the zone into the Gulf affects waters that host Saudi, Kuwaiti, Iraqi, and UAE export terminals.
What happens if escalation continues at the current pace? I am convinced the key tipping point will be the exclusion zone rather than the number of tanker strikes. While Gulf producers currently shuttle barrels with transponders off, the market remains short of supply but not paralyzed. Expansion of the zone to terminals would shift the situation from constrained transit to blocked production, and that scenario would push prices far beyond the current range.
Also notable is the gap between Washington's rhetoric and reality. Trump on Friday called the conflict "small," and Vice President J.D. Vance said he would not call it a war. Yet 18 US service members have died over six months, munitions are being consumed, and polls show weak approval of presidential actions — a political domestic factor that could make Republicans risk losing control of Congress in the November midterms. It seems to me this domestic political constraint, more than military exhaustion, will limit US escalation as November approaches.
I expect that if escalation continues at the present pace, Brent will hold in a $100–$110 per barrel range through the end of September, and refined-product markets will move even further ahead because US diesel margins have already hit record territory.
A declared exclusion zone that actually cuts off part of the Gulf could send prices to $130 within a few sessions. I do not rule out the opposite scenario either, where the approach of midterm elections forces Washington to seek a quick resolution, and prices snap back toward $80 just as quickly.
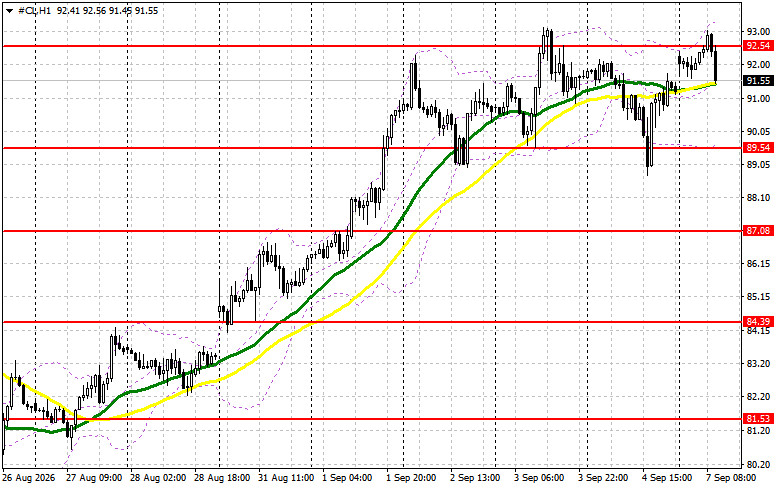
Regarding the current technical picture for oil, buyers need to reclaim the nearest resistance at $92.50. That would allow targeting $96.54, above which a breakout would become rather difficult. The most distant target is in the $100.40 area. If oil falls, bears will try to take control of $89.54. If they succeed, a break of that range would deliver a serious blow to bulls and push Oil toward the $87.08 low, with a further prospect of reaching $84.40.
The material has been provided by InstaForex Company - www.instaforex.comGold Stuck Between Strong Employment and Tankers in the Strait of Hormuz
07.09.2026
Gold fell another 0.8 percent to $4,392 per ounce. Silver declined 0.7 percent to $65.75, platinum fell, and palladium rose.
The reason was a combination of two factors, each of which alone works against the metal. Friday's data showed US employment rose by 162,000 in August, with unemployment unchanged, strengthening arguments for a rate hike at the September 15–16 meeting. Traders raised the odds of such a step to roughly 60 percent, and higher borrowing costs traditionally undermine support for non-yielding gold.

The second factor came from the Middle East and works through the same rate logic. Iran said it attacked three oil tankers in the Strait of Hormuz, as well as several US-linked vessels, in response to American strikes on ships over the weekend. Brent rose above $97 per barrel. Here lies the main paradox of the moment: geopolitical escalation, which, by textbook logic, should lift a safe-haven asset, pushes it down because rising energy prices increase inflation expectations and raise the chances of policy tightening.
Technically, the metal returned below the 200-day moving average it only reclaimed a few weeks ago. Since the bounce from around $4,000 in July, gold has traded in a relatively narrow range, and last week it oscillated on both sides of $4,400 while traders repeatedly revised Federal Reserve policy expectations.
Another strong producer or consumer price report expected this week could reinforce the tightening story and push gold further below $4,400. In contrast, softer inflation would relieve some pressure only temporarily and act more like a breather than a reversal.
How serious is this threat for the medium-term picture? In my view, it is far less severe than the quotes suggest, and the behavior of large capital confirms this. Central bank buying and the narrative of debasement recall the same rally that took the metal to a record near $5,600 in January, and the world's largest managers have been rebuilding gold positions in recent weeks. Investors buying now are focused not on the September meeting but on the resilience of US finances overall.
As noted above, the resolution will come this week when CPI is released. I expect that if disinflation is confirmed, the metal will return to the $4,450–4,500 area, while a hot report will send it toward $4,250. I lean toward the view that, even in the second scenario, the decline will be limited, since buyers on dips have been active below $4,300 for three consecutive months. The risk to this forecast remains in the Strait of Hormuz: a full blockage of the strait with halted tanker traffic would create a situation in which the inflation channel overwhelms the safe-haven channel so much that the metal loses support even amid weak inflation.
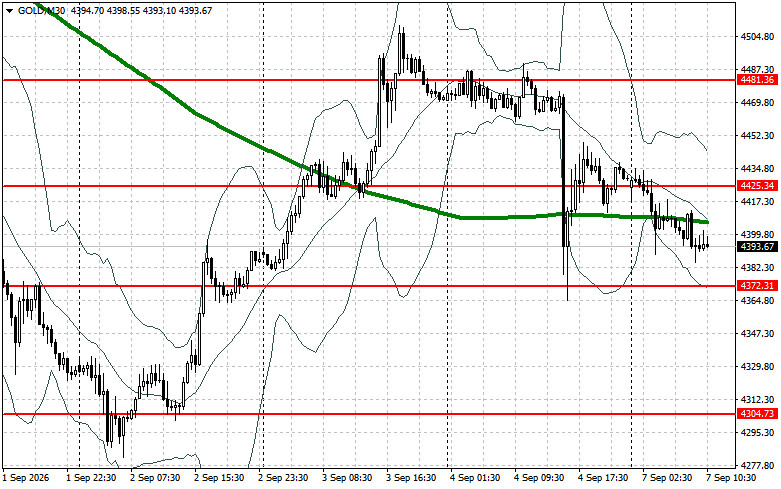
Regarding the current technical picture for gold, buyers need to reclaim the nearest resistance at $4,425. That would allow targeting $4,480, above which a breakout would become rather difficult. The most distant target is in the $4,540 area. If gold falls, bears will try to take control of $4,372. If they succeed, a break of that range would deal a serious blow to bulls and push gold toward the $4,304 low, with a further prospect of reaching $4,249.
The material has been provided by InstaForex Company - www.instaforex.comUtilities flash warning signal
07.09.2026
The US economy added 162,000 jobs in August, nearly three times consensus, marking a sharp rebound from July's 21,000. What's good news for the labor market has turned into bad news for equities: the S&P 500 closed lower, with consumer discretionary, healthcare and energy among the biggest decliners.
Stock index performance
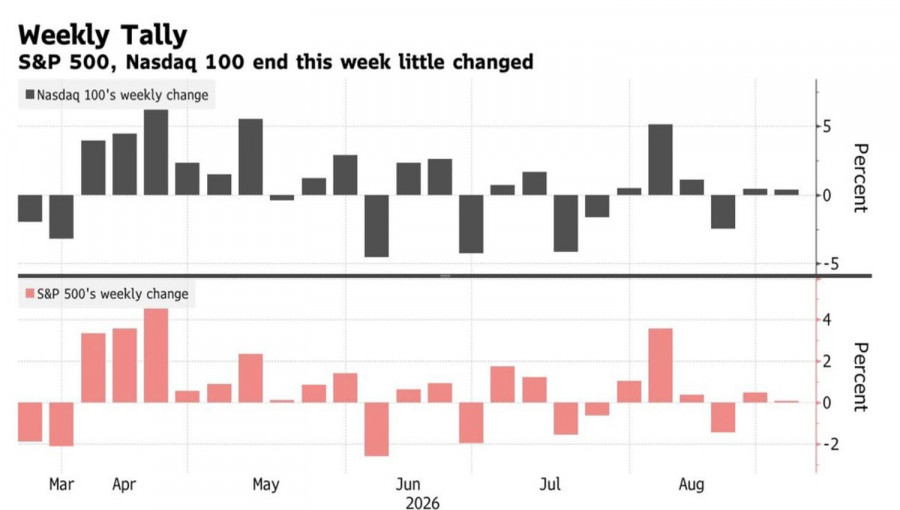
Why? Strong payrolls remove the Fed's clearest excuse to hold off on a Sept. 16 rate hike. The odds of tightening jumped from 52% to 60% immediately after the release. UBS Group now models two rate hikes, in September and December, even as US President Donald Trump called for lower interest rates, citing a "much stronger" US credit picture. Markets, however, clearly fear the opposite scenario.
Meanwhile, the Wall Street fear gauge, the VIX, sits calmly around 14,more than 20% below its annual average, as if unaware of the nervousness beneath the surface. And there is reason to be uneasy: utilities, normally the market's quietest sector, are now one of the two worst performers year?to?date after an extraordinary surge of over 11% through late February.
Dynamics of market expectations for Fed funds rate
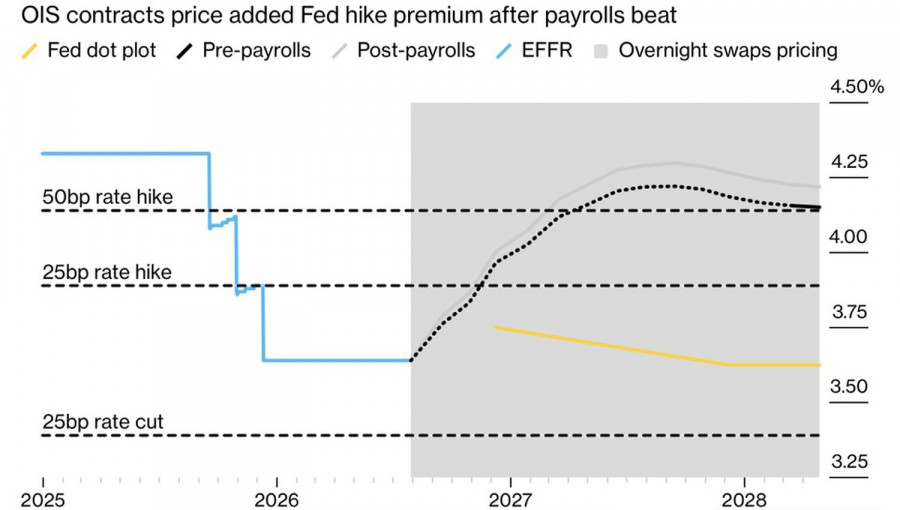
That quiet is the key signal. Utilities have long been the canary in the coal mine for equities — the sector most sensitive to the pace of Fed tightening because it depends on cheap borrowing and steady dividends. History supports the metaphor: the Dow Jones Utility Average led the S&P 500 peak in 21 of the last 30 bull-market tops since 1930, and after each such lead, indices have retraced more than 29% on average.
For now, the upswing is intact and corporate profits continue to feed the rally — the S&P 500 is up about 13% year-to-date. The question is how long that buffer will hold. Traders are shifting focus to Friday's consumer price data. Those numbers, not a single jobs report, will decide whether inflation stays above the Fed's 2% target and whether the central bank must tighten further.
So the market is in an uncomfortable trap: the stronger the economy, the scarier it looks for investors. Will Wall Street heed the canary's warning before it is too late?
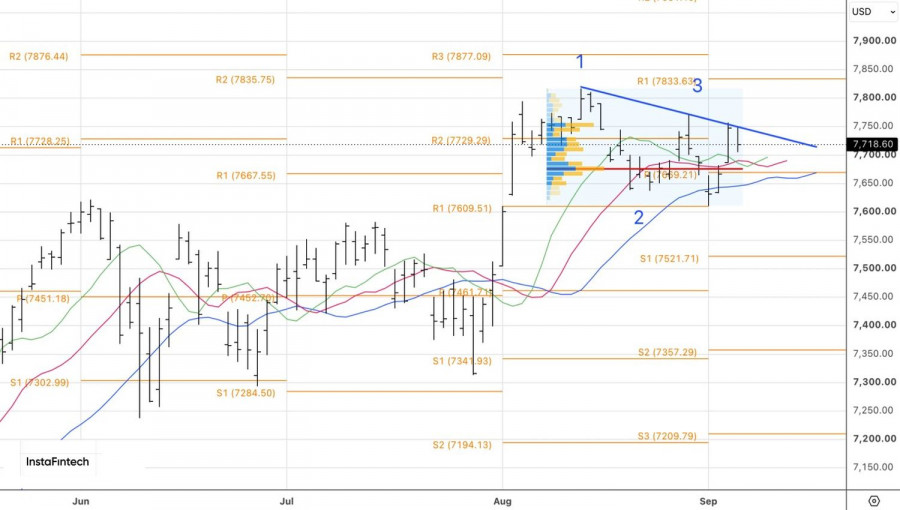
Technically, the daily S&P 500 chart shows a bounce off the trendline within a Three Touch pattern. The 1-2-3 reversal scenario can still be revived. A break below fair value at 7,675 would be a sell signal. Conversely, reclaiming levels above 7,755 would give bulls reason to buy.
The material has been provided by InstaForex Company - www.instaforex.com$174.6M vs $730.8M: why a slowdown in inflows doesn't mean outflows
07.09.2026
After Friday's plunge toward the $79,000 area, Bitcoin remained trading around that level. However, US spot Bitcoin ETFs recorded only $174.6 million in net inflows on Friday, September 4. That's a sharp slowdown compared with Thursday, September 3, when inflows were $730.8 million. The 76.1% decline also shows that the number of funds with positive inflows dropped from seven to just two. That concentration deserves particular attention, because the last trading session was effectively supported by two institutions rather than a broad front of buyers.

The positive inflows were driven exclusively by BlackRock's IBIT (+$117.4M) and Fidelity's FBTC (+$57.2M), whereas on Thursday ARKB, BITB, MSBT, GBTC, and BTC also finished in the green. This primarily benefits the two largest market players, whose dominant positions only strengthen when overall interest wanes, while it hurts smaller issuers. It implies that institutional demand is concentrating around the most liquid and recognizable brands even amid a general slowdown, rather than being spread evenly across the full lineup of a dozen competing funds. It's important to emphasize that the remaining ten products — including BITB, ARKB, BTCO, EZBC, BRRR, HODL, BTCW, MSBT, GBTC, and BTC — showed zero net inflows, not outflows.
Should this slowdown be viewed as a worrying signal? I don't think so, because the absence of outflows even amid a sharp drop in interest suggests investors who are holding positions are not rushing to take profits after a strong 30-day rise in the asset.
In my view, the slowdown in inflows is more a reaction to the data than a trend reversal, and I expect broader fund participation to recover already early this week as market trading activity returns to normal volumes.
Trading recommendations
Bitcoin
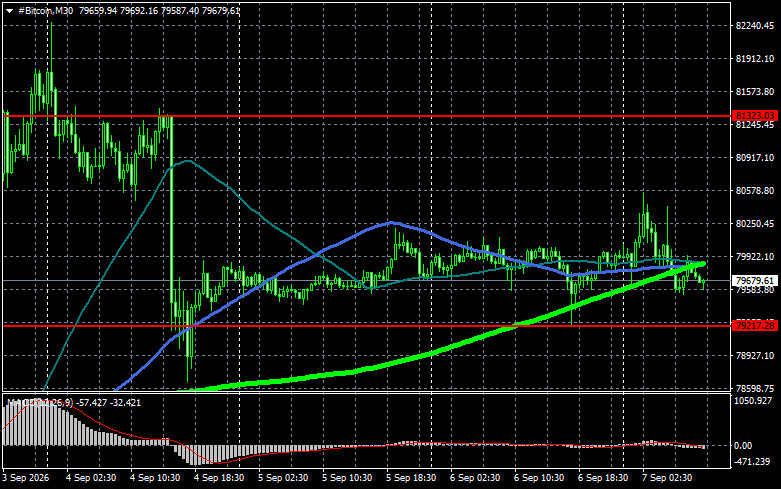
Buyers are currently targeting a return to $81,300, which would open a direct path to $83,600 and then on to $85,600; surpassing $85,600 would signal attempts to resume a bull market. On the downside, I expect buyers at $79,200. A return of the price below that area could quickly push BTC toward $77,200. The furthest target on the downside is around $75,300.
Ethereum
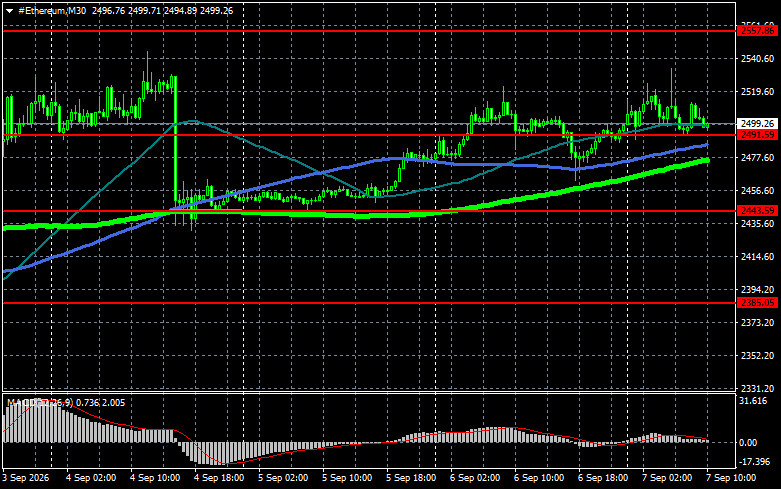
A clear hold above $2,557 opens a direct path to $2,624. The furthest upside target is the high around $2,684; breaking above that would indicate strengthening bullish sentiment and renewed buyer interest. On the downside, I expect buyers at $2,491. A drop back below that area could quickly push ETH toward $2,443. The furthest downside target is around $2,385.
What's on the chart
- The red lines represent support and resistance levels, where the price is expected to either pause or react sharply.
- The green line shows the 50-day moving average.
- The blue line is the 100-day moving average.
- The lime line is the 200-day moving average.
Price testing or crossing any of these moving averages often either halts movement or injects fresh momentum into the market.
The material has been provided by InstaForex Company - www.instaforex.comUSDJPY: Simple Trading Tips for Beginner Traders on September 7. Review of Yesterday's Forex Trades
07.09.2026
Trade review and tips for trading the Japanese yen
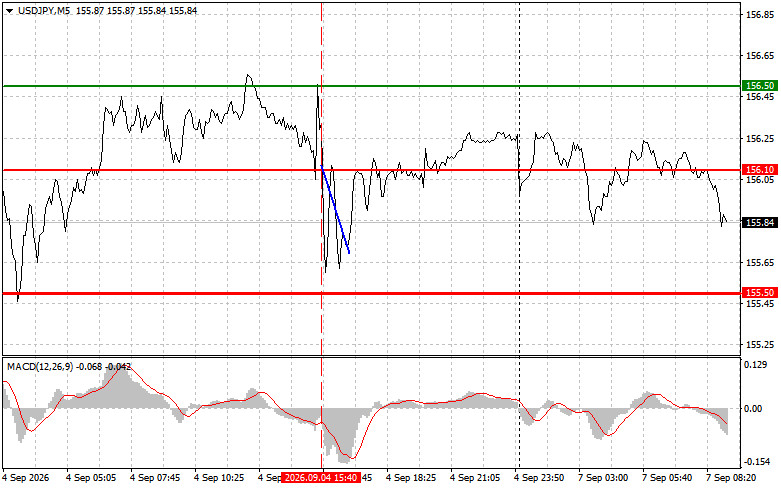
The price test at 156.10 occurred when the MACD indicator was just beginning to move down from the zero line, confirming the correct entry point to sell the dollar. As a result the pair fell about 40 pips.
The August NFP came in materially stronger than expected, adding 162,000 jobs versus a 55,000 consensus, and revisions to prior months all but erased the story of a weakening labor market. For the dollar, this was a powerful fundamental argument, since the dovish stance of parts of the Federal Reserve was built precisely on weak employment, and that support vanished. Under normal circumstances, I would have expected a confident rise in USD/JPY on the back of such a report. However, the yen situation is currently special because the Bank of Japan, in coordination with the US, continues currency intervention, keeping the dollar under pressure. In my view, this confrontation between fundamentals and direct intervention is what now determines the pair: a strong employment report pulls USD/JPY up, while ongoing regulatory actions push it down. I believe that in the near term intervention can restrain the pair's rise, but it will become increasingly difficult for the market to ignore such a robust labor market.
The resolution now shifts to the inflation report on September 11, since it will determine how hawkish the Fed will be. For now, I keep in mind that if the dollar attempts to recover the strong NFP, USD/JPY buyers risk bumping into further intervention by Japanese authorities, so I expect sharp moves in the pair with caution in both directions.
As for intraday strategy, I will rely mainly on execution of Scenarios No. 1 and No. 2.
Buy scenarios
Scenario No. 1: I plan to buy USD/JPY today if the entry point around 156.07 (the green line on the chart) is reached, with a target to rise to 156.46 (the thicker green line on the chart). Around 156.46, I intend to exit long positions and open short positions in the opposite direction (expecting a 30–35 pip move in the opposite direction from that level). It is best to return to buying the pair on corrections and significant pullbacks in USD/JPY. Important! Before buying, make sure the MACD indicator is above the zero line and is just beginning to rise from it.
Scenario No. 2: I also plan to buy USD/JPY today in the event of two consecutive tests of 155.69, with the MACD indicator in an oversold area. This will limit the pair's downside potential and lead to an upward reversal. One can expect a rise toward the opposite levels of 156.07 and 156.46.
Sell scenarios
Scenario No. 1: I plan to sell USD/JPY today only after the 155.69 level (the red line on the chart) is broken, which will lead to a rapid decline in the pair. The key target for sellers will be 155.33, where I plan to exit shorts and immediately open longs in the opposite direction (expecting a 20–25 pip move in the opposite direction from that level). Sellers will return at any moment — we only need any hint from the central bank. Important! Before selling, make sure the MACD indicator is below the zero line and is just beginning to decline from it.
Scenario No. 2: I also plan to sell USD/JPY today if there are two consecutive tests of 156.07 while the MACD indicator is in an overbought area. This will limit the pair's upside potential and lead to a downward reversal. One can expect a decline toward the opposite levels of 155.69 and 155.33.
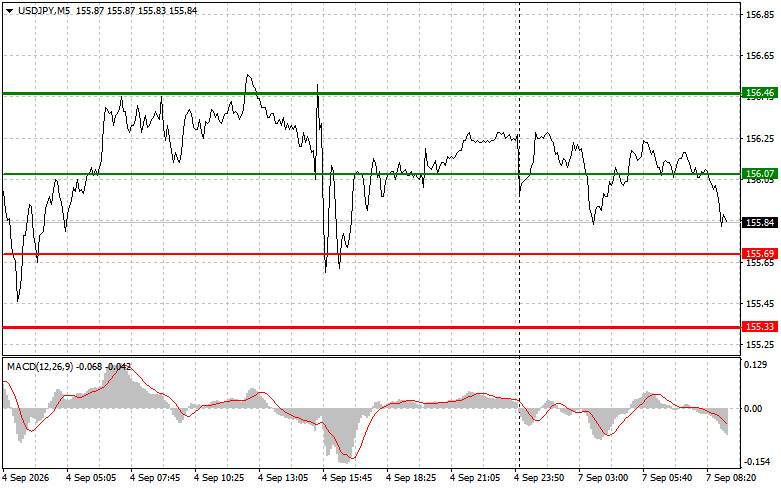
What to Look for on the Chart:
- Thin Green Line – Entry price at which you can buy the trading instrument;
- Thick Green Line – Estimated price where you can set Take Profit or manually secure profits, as further growth above this level is unlikely;
- Thin Red Line – Entry price at which you can sell the trading instrument;
- Thick Red Line – Estimated price where you can set Take Profit or manually secure profits, as further decline below this level is unlikely;
- MACD Indicator. When entering the market, it's important to consider overbought and oversold zones.
Important: Beginner traders in the Forex market need to be very cautious when making entry decisions. It is best to stay out of the market ahead of significant fundamental reports to avoid being caught in sharp price fluctuations. If you decide to trade during news releases, always set stop orders to minimize losses. Without stop orders, you can quickly lose your entire deposit, especially if you do not employ money management practices and trade large volumes.
Also, remember that successful trading requires a clear trading plan, similar to the one provided above. Making spontaneous trading decisions based on current market conditions is inherently a losing strategy for intraday traders.
The material has been provided by InstaForex Company - www.instaforex.comGBPUSD: Simple Trading Tips for Beginner Traders on September 7. Review of Yesterday's Forex Trades
07.09.2026
Trade review and tips for trading the British pound
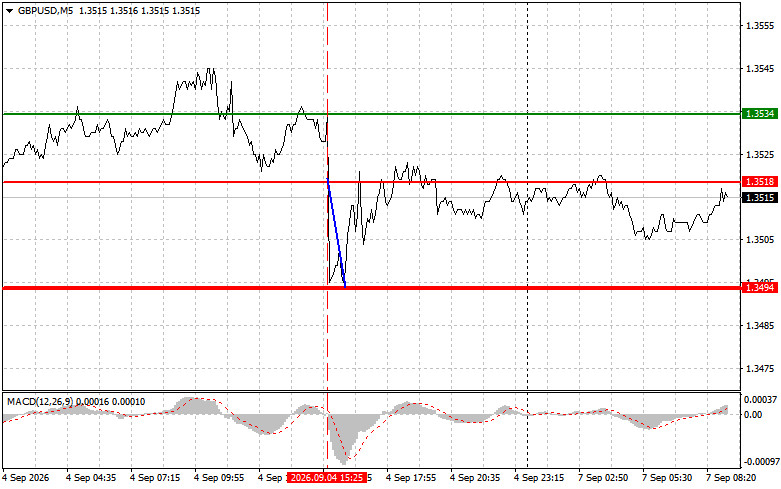
The price test at 1.3518 occurred when the MACD indicator was just beginning to move down from the zero line, confirming the correct entry point to sell the pound. As a result the pair fell toward the target level of 1.3494.
The strong US employment report set the tone for trading and weakened the pound. The 162k gain versus a 55k consensus was already surprising, but the real shock was the revisions: July's employment decline was revised into a rise. In other words, a week of talk about a weakening labor market — fueled by weak ADP and soft ISM indices — was based on a figure that didn't exist. The pound became dependent on external forces and gave ground to the dollar, since the US currency's strength following the strong report undermined demand for riskier assets. Sterling had no domestic drivers, so the dollar's strength entirely determined its decline. I explain the divergence with leading indicators by methodology: it was the government sector, invisible to ADP, that pulled the report up. In my view, the situation for the Federal Reserve flipped, because the dovish stance lost its main support — the weak labor market.
Given there is no important UK data today, the pound will most likely try to regain positions and reach last Friday's highs.
As for intraday strategy, I will rely mainly on execution of Scenarios No. 1 and No. 2.
Buy scenarios
Scenario No. 1: I plan to buy the pound today if the entry point around 1.3521 (the green line on the chart) is reached, with a target to rise to 1.3542 (the thicker green line on the chart). Around 1.3542, I intend to exit long positions and open short positions in the opposite direction (expecting a 30–35 pip move in the opposite direction from that level). Expect pound strength today only after strong data. Important! Before buying, make sure the MACD indicator is above the zero line and is just beginning to rise from it.
Scenario No. 2: I also plan to buy the pound today in the event of two consecutive tests of 1.3506, with the MACD indicator in an oversold area. This will limit the pair's downside potential and lead to an upward reversal. One can expect a rise toward the opposite levels of 1.3521 and 1.3542.
Sell scenarios
Scenario No. 1: I plan to sell the pound today after the 1.3506 level (the red line on the chart) is breached, which will lead to a rapid decline in the pair. The key target for sellers will be 1.3485, where I plan to exit shorts and immediately open longs in the opposite direction (expecting a 20–25 pip move in the opposite direction from that level). Bad news will bring pressure back on the pound. Important! Before selling, make sure the MACD indicator is below the zero line and is just beginning to decline from it.
Scenario No. 2: I also plan to sell the pound today if there are two consecutive tests of 1.3521 while the MACD indicator is in an overbought area. This will limit the pair's upside potential and lead to a downward reversal. One can expect a decline toward the opposite levels of 1.3506 and 1.3485.
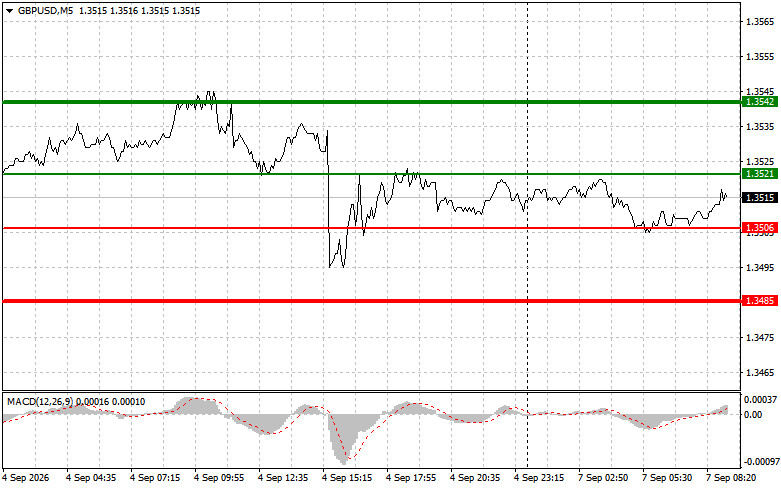
What to Look for on the Chart:
- Thin Green Line – Entry price at which you can buy the trading instrument;
- Thick Green Line – Estimated price where you can set Take Profit or manually secure profits, as further growth above this level is unlikely;
- Thin Red Line – Entry price at which you can sell the trading instrument;
- Thick Red Line – Estimated price where you can set Take Profit or manually secure profits, as further decline below this level is unlikely;
- MACD Indicator. When entering the market, it's important to consider overbought and oversold zones.
Important: Beginner traders in the Forex market need to be very cautious when making entry decisions. It is best to stay out of the market ahead of significant fundamental reports to avoid being caught in sharp price fluctuations. If you decide to trade during news releases, always set stop orders to minimize losses. Without stop orders, you can quickly lose your entire deposit, especially if you do not employ money management practices and trade large volumes.
Also, remember that successful trading requires a clear trading plan, similar to the one provided above. Making spontaneous trading decisions based on current market conditions is inherently a losing strategy for intraday traders.
The material has been provided by InstaForex Company - www.instaforex.comEURUSD: Simple Trading Tips for Beginner Traders on September 7. Review of Yesterday's Forex Trades
07.09.2026
Trade review and tips for trading the European currency
The price test at 1.1615 occurred as the MACD indicator began to move down from the zero line, confirming the correct entry point to sell the euro. As a result, the pair plunged to around 1.1595. Long positions from there on the rebound allowed taking another roughly 20 pips of profit from the market.
The August US employment report surprised the market and supported the dollar. Nonfarm payrolls rose by 162,000 versus the expected 55,000. Still, the revisions were even more important: July was revised from negative to positive, and the whole narrative about a weakening labor market collapsed before our eyes. The July miss had been the basis for the pause discussion, and now that argument is gone. The single currency lost ground as a result, because a strong labor market frees the Federal Reserve's hands. I believe the report was a cold shower for doves like Waller and Williams, who had adopted a soft stance on weak employment data. But in my view, EUR/USD will remain under pressure until the inflation report on September 11, and only a weak CPI can return initiative to the euro.
Today, the single currency enters the day focused on a block of European data: in addition to German industrial production and the Sentix investor confidence indicator, revised eurozone Q2 GDP and employment figures will be released. GDP and employment are key here because they confirm or refute economic resilience and, in turn, influence the European Central Bank's stance. I regard industrial production and Sentix as more secondary indicators that complement the overall picture.
The outlook for the euro, in my view, is cautious. If the revised figures match forecasts and deliver no surprise, pressure on EUR/USD can return, especially since the dollar strengthened after the unexpectedly strong NFP. Only a notable positive surprise can seriously support the single currency now, while a neutral result will leave the initiative with the US currency. Until the releases, I expect restrained euro dynamics.
As for the intraday strategy, I will rely mainly on executing Scenarios No. 1 and No. 2.
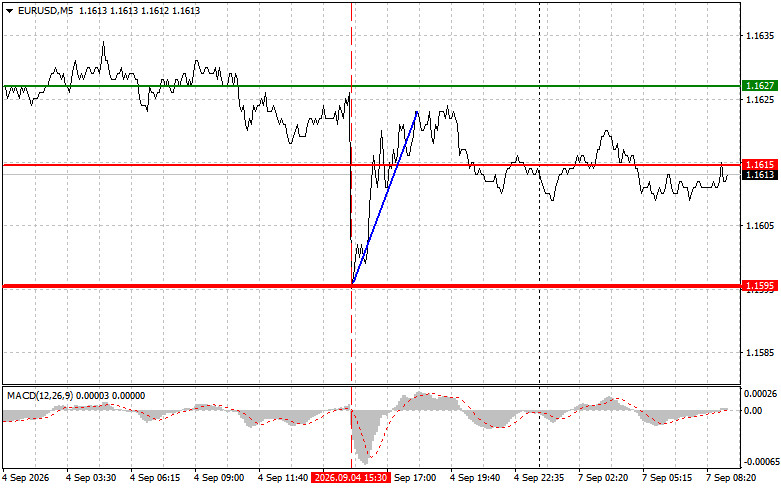
Buy scenarios
Scenario No. 1: Today the euro can be bought if the price reaches around 1.1619 (the green line on the chart), with a target to rise to 1.1637. At 1.1637, I plan to exit the market and sell the euro in the opposite direction, expecting a 30–35-pip move from the entry point. Expect euro strength only after very strong data. Important! Before buying, make sure the MACD indicator is above the zero line and is just beginning to rise from it.
Scenario No. 2: I also plan to buy the euro today in the event of two consecutive tests of 1.1608, with the MACD indicator in an oversold area. This will limit the pair's downside potential and lead to an upward reversal. One can expect a rise toward the opposite levels of 1.1619 and 1.1637.
Sell scenarios
Scenario No. 1: I plan to sell the euro after the level 1.1608 (the red line on the chart) is reached. The target will be 1.1589, where I plan to exit the market and buy immediately in the opposite direction (expecting a 20–25 pip move in the opposite direction from that level). Pressure on the pair will return today with weak data. Important! Before selling, make sure the MACD indicator is below the zero line and is just beginning to decline from it.
Scenario No. 2: I also plan to sell the euro today if there are two consecutive tests of 1.1619 while the MACD indicator is in an overbought area. This will limit the pair's upside potential and lead to a downward reversal. One can expect a decline toward the opposite levels of 1.1608 and 1.1589.
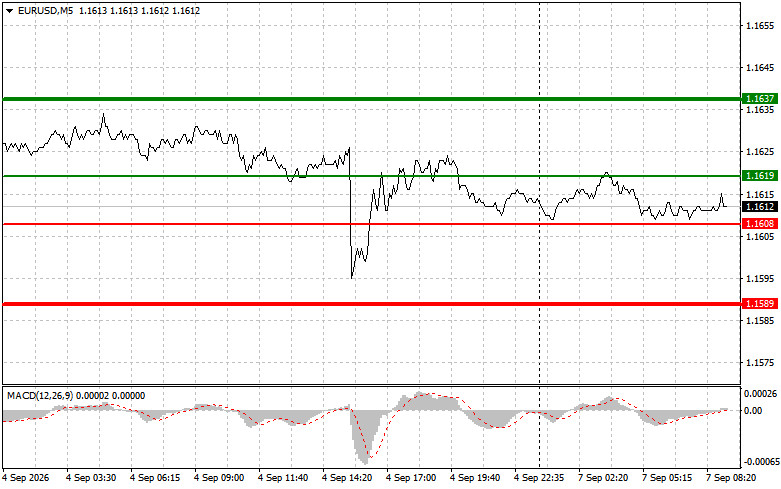
What to Look for on the Chart:
- Thin Green Line – Entry price at which you can buy the trading instrument;
- Thick Green Line – Estimated price where you can set Take Profit or manually secure profits, as further growth above this level is unlikely;
- Thin Red Line – Entry price at which you can sell the trading instrument;
- Thick Red Line – Estimated price where you can set Take Profit or manually secure profits, as further decline below this level is unlikely;
- MACD Indicator. When entering the market, it's important to consider overbought and oversold zones.
Important: Beginner traders in the Forex market need to be very cautious when making entry decisions. It is best to stay out of the market ahead of significant fundamental reports to avoid being caught in sharp price fluctuations. If you decide to trade during news releases, always set stop orders to minimize losses. Without stop orders, you can quickly lose your entire deposit, especially if you do not employ money management practices and trade large volumes.
Also, remember that successful trading requires a clear trading plan, similar to the one provided above. Making spontaneous trading decisions based on current market conditions is inherently a losing strategy for intraday traders.
The material has been provided by InstaForex Company - www.instaforex.comIntraday Strategies for Beginner Traders for the Euro and Pound on September 7
07.09.2026
The dollar moved back and forth reasonably well, but overall, if you look at the situation, the balance of forces has not changed significantly.
Yes, US employment rose by 162,000 in August against a consensus of only 55,000, and unemployment remained at 4.1%. But this report diverged sharply from all leading indicators at once, since ADP counted only 38,000, the ISM employment index in services remained in contraction, and the manufacturing ISM fell. At the same time, wages rose 3.1% year-on-year, without acceleration, which eases some inflationary concerns. For the euro and the pound, such a strong report was a short-term hit, and both European currencies gave ground to the dollar. But in my view, the situation for the Federal Reserve has not changed materially; rather, the dovish narrative that relied on a weak labor market has suffered. So, until the inflation report on September 11, pressure on EUR/USD and GBP/USD will persist, and the initiative will remain with the stronger dollar.
Today, the focus for the single currency will be on German industrial production figures and the Sentix investor confidence indicator. Still, a far more important item will be the revised Q2 eurozone GDP, along with employment data. In my opinion, the market will watch primarily whether the revised data confirm the prior picture of growth. If the figures match economists' forecasts, pressure on EUR/USD could return, as without a positive surprise the single currency will struggle to resist the dollar, strengthened by the strong US employment report. Nevertheless, I keep in mind the approaching European Central Bank meeting on September 10, where a rate hike to 2.5% is almost fully priced in, and I believe that anchor will limit the depth of any possible euro decline.
For the pound, there is no domestic data today at all, so bulls will have a chance to restore the pair after Friday's sell-off, but it is unlikely to leave its main sideways channel 1.3480–1.3545.
Momentum strategy (breakout trading)
The essence of this approach is to wait for a decisive price exit beyond a key level and join the forming impulse rather than trying to guess a reversal in advance. Breakout models are good precisely when the market gains momentum, and big players begin to push price in one direction, so I prefer to act strictly on the breakout rather than in anticipation.
For the EURUSD pair. I consider long positions on a breakout of 1.1621. In my view, a close above this level can open the euro's path to 1.1641 initially and, if momentum continues, to the further target 1.1657. Sequential clearing of these levels will indicate that initiative has truly passed to buyers. From the opposite side, look for short positions on a breakout of 1.1601, since a drop below it opens room to 1.1587 and then to 1.1568. While the pair is trapped between these boundaries, I prefer to remain patient and wait for a clean breakout rather than enter inside the range.
For the GBPUSD pair. I plan to buy on a breakout of 1.3521, because a close above it can push the pound toward 1.3545 and, if the move develops, to 1.3573. Short positions make sense on a breakout of 1.3501, since breaking it would hit buyers' positions and open the way down to 1.3480 and then to 1.3457. As with the euro, I bet on impulse rather than trying to catch moves inside the boundaries where signals are too often false.
Mean Reversion strategy (return trading)
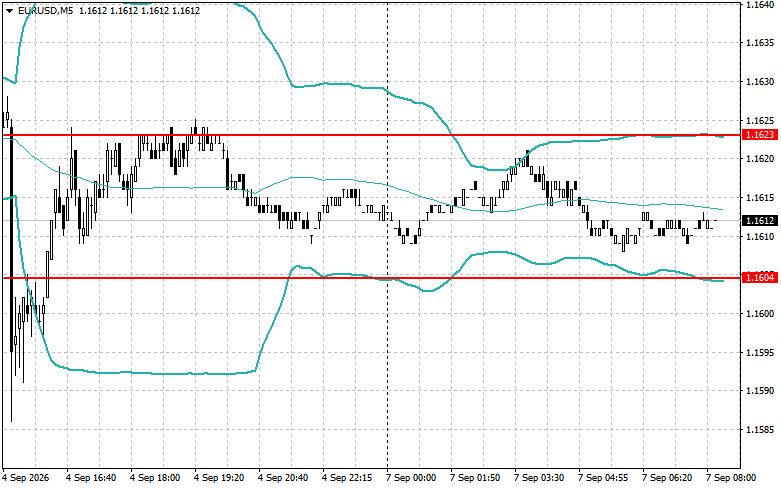
This approach is opposite in logic and is built on the idea that not every breach becomes a real breakout. Often price punctures an important level but fails to find support from large participants and returns, and such failed exits provide some of the most reliable entry points. Here I don't chase the impulse but work against it, waiting until a false breakout is exhausted.
For the EURUSD pair. I will look for short positions after a failed exit above 1.1623 when price returns below that level, since such a scenario usually indicates buyers lack the strength to hold above and initiative passes to sellers. Conversely, I'll look for longs after a failed attempt to push below 1.1604, on the price's return to that level, which will signal exhaustion of bearish pressure. In both cases, the key signal for me is the fact of the return itself, not the initial poke through the level.
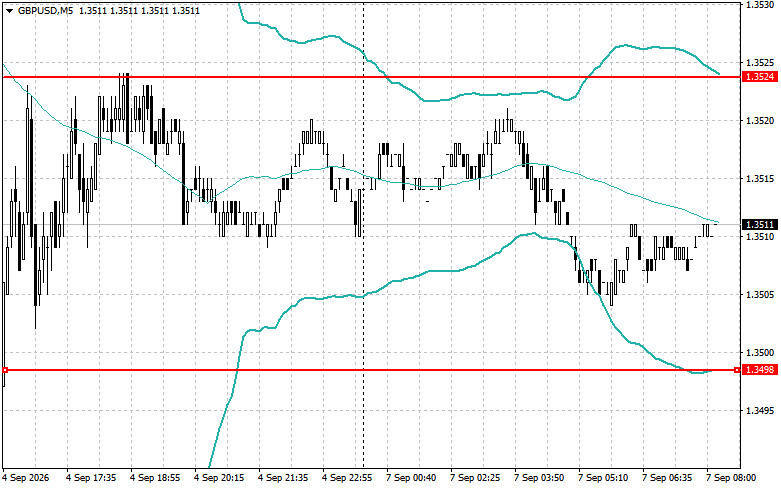
For the GBPUSD pair. The logic is identical. I will look for shorts after a failed exit above 1.3524 on a return below that level, and for longs after a failed attempt to hold below 1.3498 on a return to that level. Such entry points are good because they imply limited risk and a clear stop placement. If the return does not occur and price instead continues the breakout, the signal is immediately invalidated, and I prefer to step away and wait for the next opportunity.
The material has been provided by InstaForex Company - www.instaforex.comCrypto and AI rally fades, but Pompiliano still backs BTC and AI stocks
07.09.2026
Bitcoin and Ether have been trading sideways for several weeks following a sharp jump. Over the past two weeks, both assets have moved in horizontal channels, and the higher timeframe technical picture allows for the possibility of a fresh leg lower. The US Treasury's decision to expand long-term bond buybacks sparked the crypto market rally, but questions remain about how long that move can last if it rests on a single supporting factor. The fundamental backdrop remains weak for the crypto segment, and downtrends in both Ether and Bitcoin have not yet been broken. We still see no grounds for a sustained advance. Sentiment around the crypto sector improved markedly in August, but traders should beware: this may be a pump or manipulation.
Meanwhile, Matt Pompiliano, chief investment officer at ProCap Financial, told investors that Bitcoin and AI stocks will be the best investment pairing over the next 20 years. He argued Bitcoin could begin a new bull trend driven by high US inflation, rising government debt, and policy responses designed to lower real borrowing costs—namely, actions by the Treasury and the Fed that reduce yields and stimulate the economy. Recall that President Donald Trump continues to call for lower Fed rates, while the US Treasury has begun buying its own long bonds to cap yields. Pompiliano said he expects high public spending to persist, and the government may try to reduce the real burden of debt via additional dollar issuance, which would further debase the currency and lift risk assets.
Pompiliano also suggested that Bitcoin could reach $1 million under an extreme negative economic scenario. If instead the US pursues a path focused on faster economic growth and production, AI could boost labor productivity and deliver the growth needed. He added that as the money supply expands, Bitcoin and other assets will inevitably appreciate.
Trading recommendations for BTC/USD
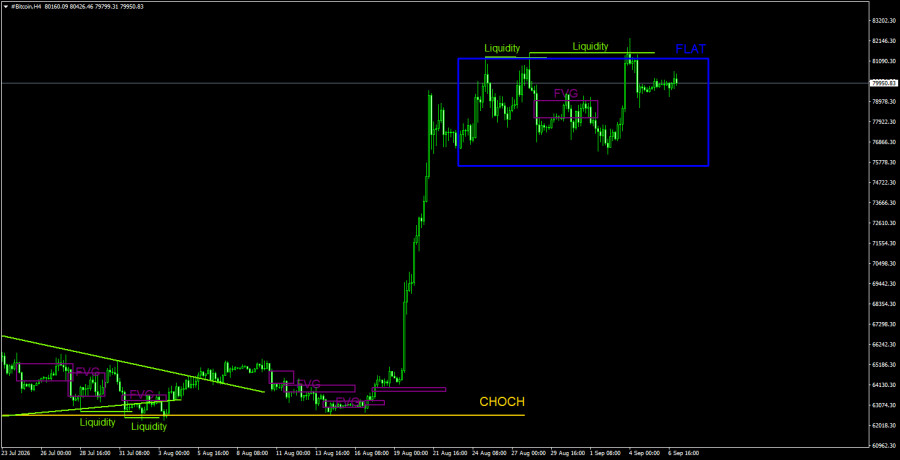
Bitcoin remains in a downtrend despite last week's strong rally. We continue to expect a decline toward $57,500 (the 61.8% Fibonacci retracement of the three-year uptrend), although that level has in effect already been tested. We do not believe the downtrend is over. The recent rise in Bitcoin looks only weakly like a corrective move and is not a solid reason to open longs; it resembles a pump. Liquidity may be taken off the $82,850 high, which could trigger a new leg lower and confirm a transition to a sideways channel. On the 4-hour time frame, we expect another downleg from the most recent bearish FVG.
Trading recommendations for ETH/USD
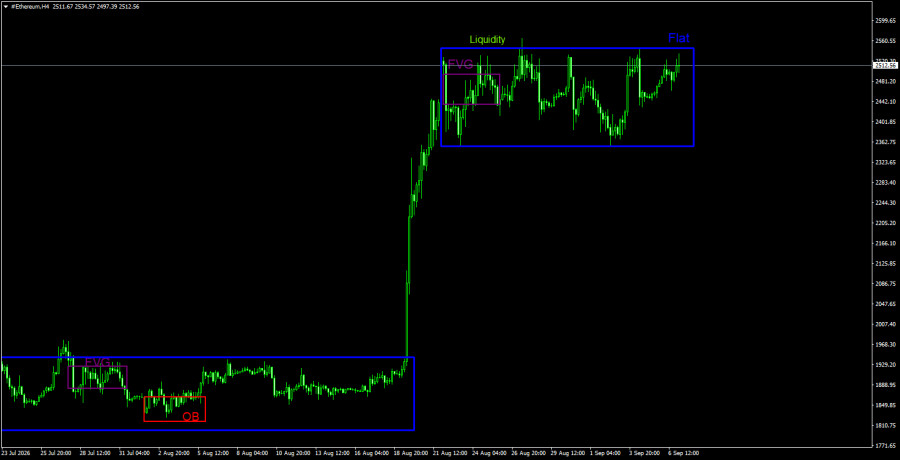
On the daily time frame, the technical picture for Ether has changed dramatically in just a few days. Ether may now be starting a new uptrend. However, traders should base positions primarily on the weekly chart, where Ether could head toward $4,800, the upper boundary of a five-year sideways channel. The nearest bearish FVG on the daily chart has been worked off, but that FVG sits within the prior trend and, if it triggers a reaction, it will most likely be corrective. We also note liquidity removal around the April 17 high and liquidity grabs on the 4-hour chart; Bitcoin has taken liquidity on the 4-hour chart as well. Thus, a correction is likely, and a flat has formed on the 4-hour Ether chart. Inside that flat, internal patterns carry limited weight; a deviation below the lower boundary could, paradoxically, provoke an upward move in Ether.
Explanations of illustration labels
CHOCH—a break in trend structure.
Liquidity—stop losses and pending orders market makers use to build positions.
FVG—an area of price inefficiency that price moves through quickly when one side is absent; price tends to return and react to such areas in continuation of the main trend.
IFVG—inverted fair-value gap. On return to such an area, the price does not react but instead breaks through impulsively and then retests from the other side.
OB—order block: a candle where a market maker entered to take liquidity and form a position in the opposite direction.
The material has been provided by InstaForex Company - www.instaforex.comWeekly Forecast Based on Simplified Wave Analysis of GBP/USD, AUD/USD, USD/CHF, EUR/JPY, AUD/JPY, EUR/GBP, and Ethereum –
07.09.2026
GBP/USD
Brief analysis:
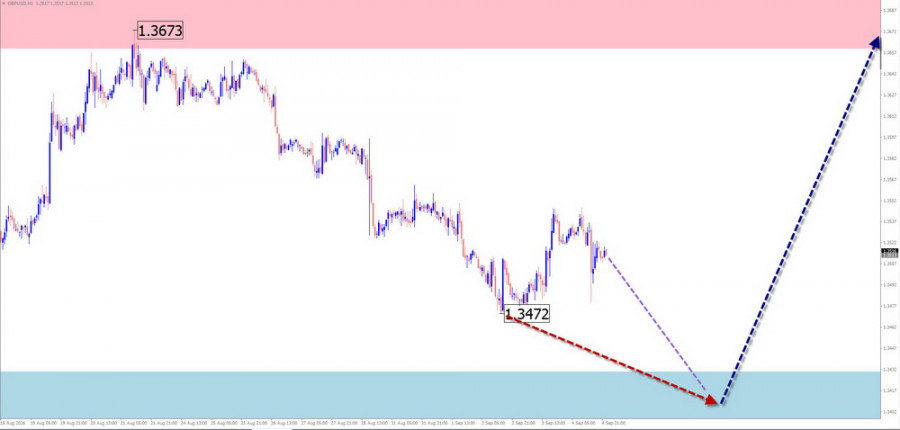
Since January this year, the direction of price movements in the British pound against the US dollar has been determined by a downward wave. An unfinished corrective part of wave (B) began at the end of June. The calculated resistance runs along the lower boundary of a potential reversal zone on the daily time frame.
Weekly forecast:
In the first few days, the most likely scenario will be a decline followed by sideways movement along the support boundaries. A reversal and resumption of the price rise will follow. When the direction changes, a brief move below the lower support boundary cannot be ruled out. The resistance zone indicates the most likely upper boundary of the pair's expected weekly range.
Potential reversal zones
Resistance:
- 1.3670/1.3720
Support:
- 1.3430/1.3380
Recommendations
Selling: Relatively risky due to the limited downward potential.
Buying: Will become relevant after confirmed reversal signals appear near the support zone.
AUD/USD
Brief analysis:
The short-term uptrend in the Australian dollar major over the past two months has brought the price into an area where several potential reversal zones on different time frames converge. The final part (C) has entered the concluding phase of the wave. Its structure does not appear complete at the time of analysis.
Weekly forecast:
Over the next couple of days, the pair's price is likely to move mainly sideways. A decline toward the upper boundary of the support zone cannot be ruled out. Subsequently, a resumption of the bullish move can be expected. The calculated resistance runs along the lower edge of a strong reversal zone, where the entire current wave is expected to be completed.
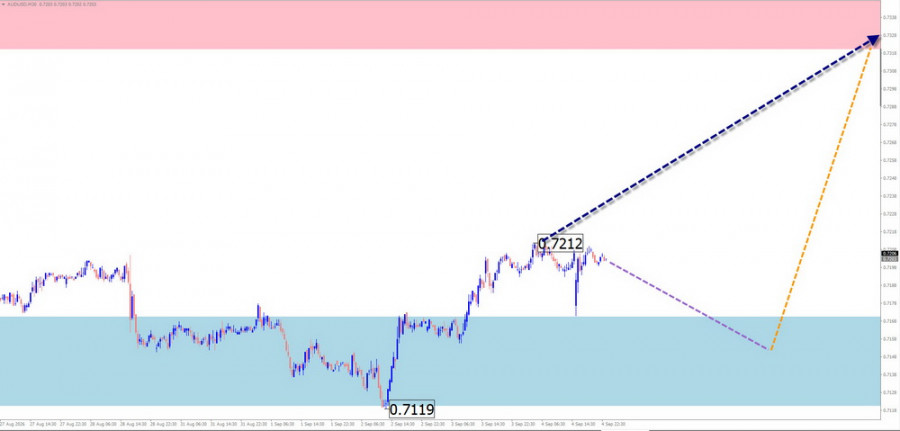
Potential reversal zones
Resistance:
- 0.7320/0.7370
Support:
- 0.7170/0.7120
Recommendations
Selling: Has limited potential. It is safer to reduce the position size.
Buying: Will become possible after signals from your trading systems appear near the support zone.
USD/CHF
Brief analysis:
Since January this year, the trend direction on the chart of the Swiss franc major has been determined by an upward wave. Since mid-June, a correction in the form of a running flat has been developing within the structure. Since August 20, a bullish move with reversal potential has been developing. The price is approaching the lower boundary of a potential reversal zone on the hourly time frame.
Weekly forecast:
In the first half of the week, sideways movement along the resistance boundaries can be expected. Closer to the weekend, the probability of a reversal and resumption of the bearish bias increases. The decline could bring the price to the calculated support levels during the current week.
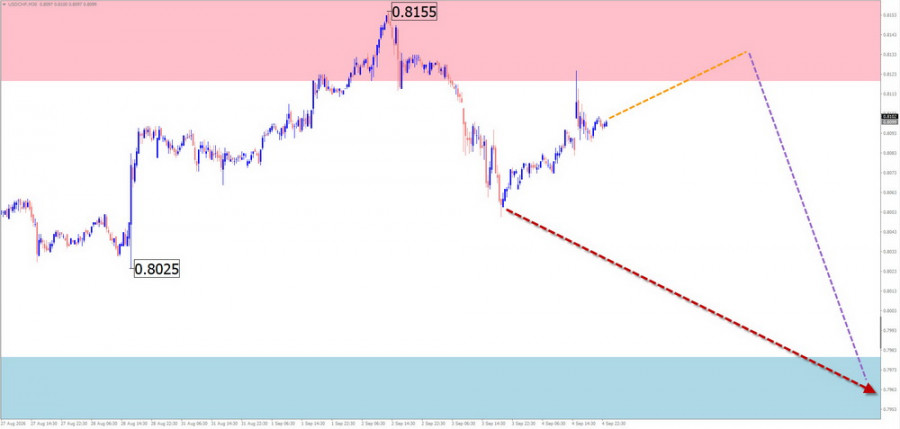
Potential reversal zones
Resistance:
- 0.8120/0.8270
Support:
- 0.7980/0.7930
Recommendations
Buying: Has little potential in the coming week.
Selling: May be considered after confirmed signals from your trading systems appear.
EUR/JPY
Brief analysis:
Over the past month, the direction of price movement in the euro/yen pair has been determined by an upward wave pattern. Within the currently unfinished final part of the wave, a counter-trend correction is developing. At the time of analysis, the wave structure appears fully complete. The wave degree of the upward segment from September 3 exceeds the retracement level.
Weekly forecast:
In the coming days, the pair is expected to move mainly sideways, with a downward bias. In the second half of the week, a reversal and resumption of the upward move can be expected near the support zone. A sharp increase in volatility cannot be ruled out during this period.
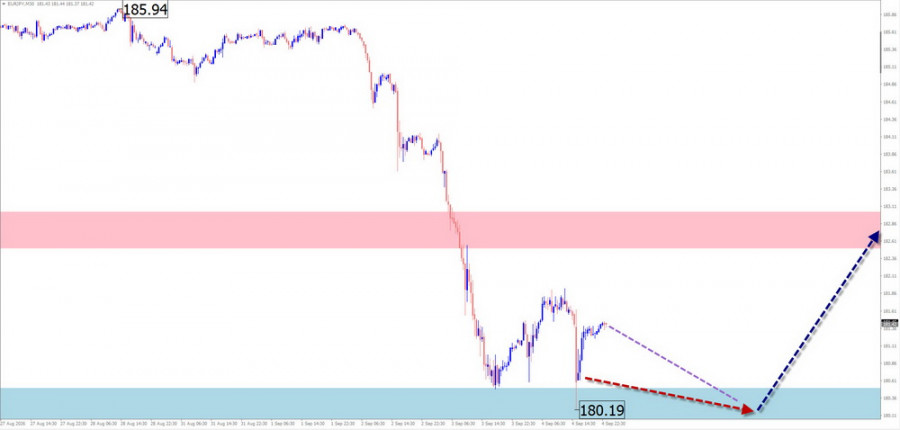
Potential reversal zones
Resistance:
- 182.50/183.00
Support:
- 180.50/180.00
Recommendations
Selling: May be used with reduced position sizes on an intraday basis.
Buying: May be considered after confirmed reversal signals from your trading systems appear near the support zone.
AUD/JPY
Brief analysis:
In the short term, since the beginning of August this year, the direction of movement in the Australian dollar/Japanese yen pair has been determined by an upward wave. Since the middle of last month, corrective part (B) has been developing within the wave structure. The wave structure has formed an extended flat on the chart. The upward segment from September 3 has reversal potential.
Weekly forecast:
Sideways movement in the pair is expected throughout the coming week. A downward bias is more likely in the first half of the week. Closer to the weekend, a reversal can be expected from the support zone, followed by a move toward the upper boundary of the price range.
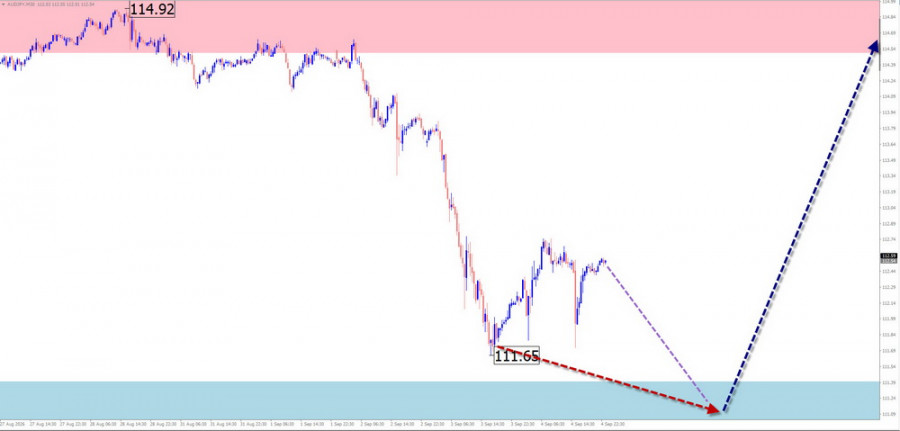
Potential reversal zones
Resistance:
- 114.50/115.00
Support:
- 111.40/110.90
Recommendations
Buying: Will become possible after signals indicating a change in direction appear in your trading systems.
Selling: May be used during individual trading sessions with reduced position sizes.
EUR/GBP
Brief analysis:
The current wave structure on the euro/pound pair is upward, starting from July 15. The pair's price is approaching the lower boundary of a cluster of several potential reversal zones on lower time frames. A corrective flat has been developing within the structure over the past few months and remains incomplete at the time of analysis.
Weekly forecast:
In the first half of the coming week, sideways movement near the resistance zone is highly likely. Pressure on the upper boundary of the resistance zone is possible. Increased volatility, a reversal, and the beginning of a decline can be expected toward the end of the week. The release of economic data may serve as a timing reference.
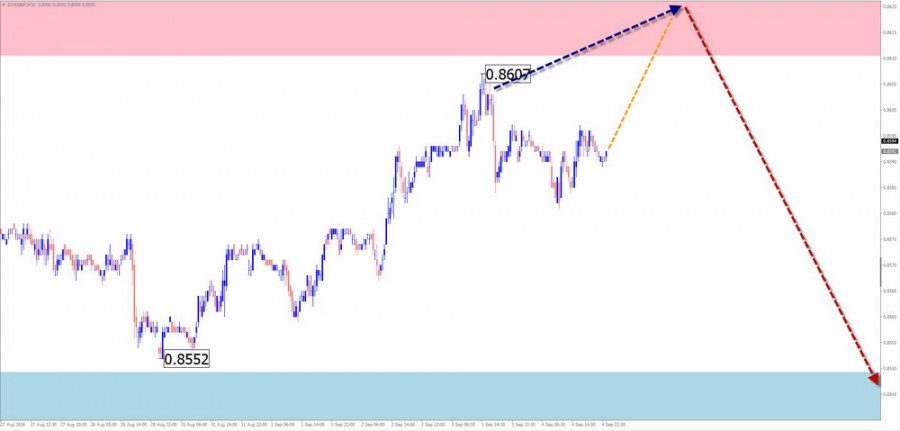
Potential reversal zones
Resistance:
- 0.8610/0.8660
Support:
- 0.8550/0.8500
Recommendations
Buying: Has limited potential and is relatively risky.
Selling: May be considered after signals from your trading systems appear near the upper reversal zone.
Ethereum
Brief analysis:
Since August 20 this year, Ethereum has been undergoing a correction relative to the previous period of strengthening. The wave does not have reversal potential, as it is correcting the latest trend segment. Over the past three weeks, the price has been forming the middle part of wave (B) in a sideways pattern, which remains incomplete.
Weekly forecast:
In the coming days, sideways price movement is expected to continue. At the beginning of the week, a downward bias is likely, with the price declining no further than the boundaries of the support zone. Toward the end of the week, the probability of increased volatility, a reversal, and the beginning of an upward move will rise.
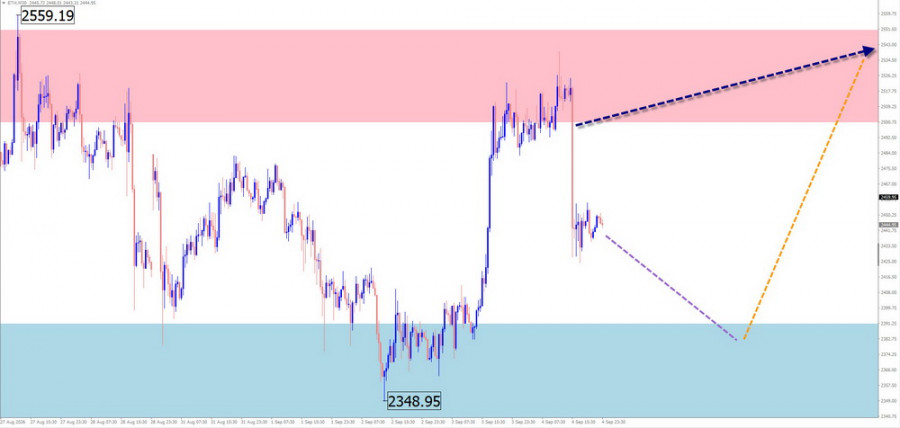
Potential reversal zones
Resistance:
- 2500.0/2550.0
Support:
- 2390.0/2340.0
Recommendations
Selling: May be used with reduced position sizes during individual trading sessions.
Buying: Not recommended until confirmed reversal signals from your trading systems appear near the support zone.
Explanations: In simplified wave analysis (SWA), all waves consist of three parts (A-B-C). In each time frame, the latest unfinished wave is analyzed. Expected movements are shown with a dashed line.
Attention: The wave algorithm does not take into account the duration of an instrument's movements over time!
The material has been provided by InstaForex Company - www.instaforex.comWeekly Forecast Based on Simplified Wave Analysis of EUR/USD, USD/JPY, GBP/JPY, USD/CAD, NZD/USD, GOLD, and Bitcoin – September
07.09.2026
EUR/USD
Brief analysis:
Analysis of the 4-hour chart of the euro major shows that the trend since the end of January this year has been driven by a downward wave. Over the past six months, a counter-trend correction in the form of a running flat has been developing on the chart and is not yet complete. The price is moving along the lower boundary of a strong potential reversal zone.
Weekly forecast:
In the coming days, the sideways movement of the European currency is likely to continue, with an overall downward bias. A pause, reversal, and subsequent rise in the exchange rate should be expected near the support zone. The resistance levels indicate the upper boundary of the pair's expected weekly range.
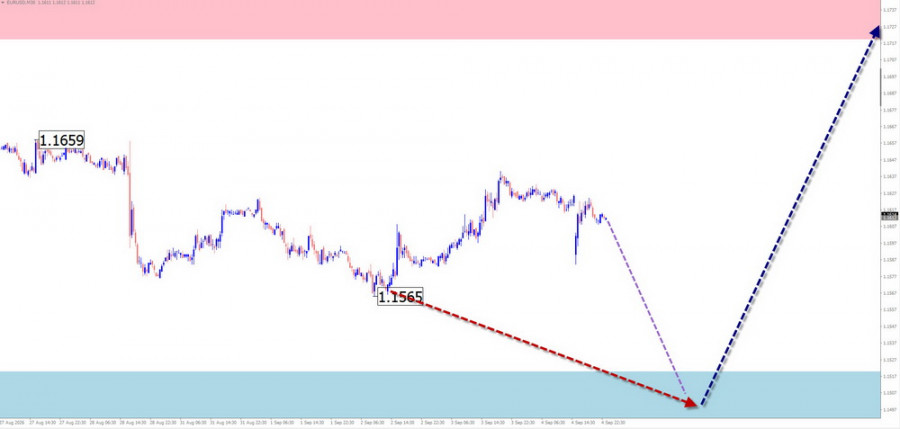
Potential reversal zones
Resistance:
- 1.1720/1.1770
Support:
- 1.1520/1.1470
Recommendations
Buying: Will become possible after confirmed reversal signals appear near the support zone.
Selling: May be used with reduced position sizes on an intraday basis.
USD/JPY
Brief analysis:
The current upward wave structure of the Japanese yen major, which began on August 3, is forming the beginning of a short-term trend. Its wave degree has reversal potential. Last week, the middle section of the developing wave was completed. The price is moving along the upper boundary of a strong potential reversal zone.
Weekly forecast:
In the coming days, sideways movement is expected, with the price moving along the support zone. A break below its lower boundary is unlikely. The second half of the week is expected to be more volatile. Closer to the weekend, a change in direction and a resumption of the price rise can be expected, potentially reaching the calculated support levels.
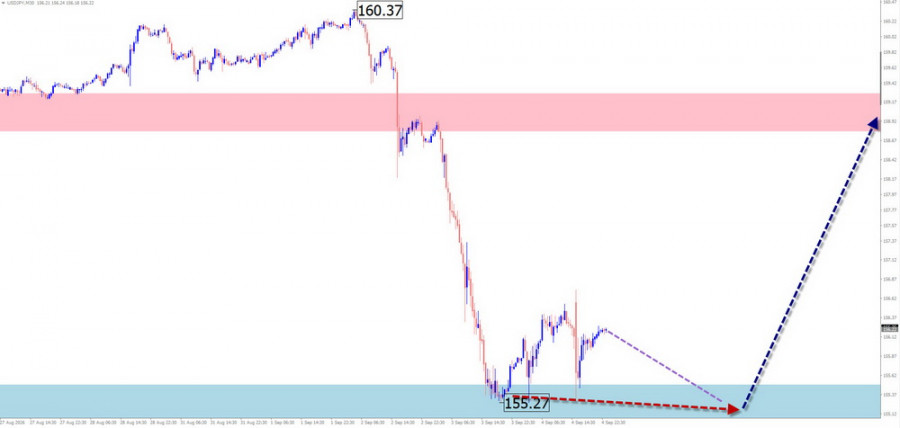
Potential reversal zones
Resistance:
- 158.80/148.60
Support:
- 155.50/155.00
Recommendations
Selling: Risky and has limited potential.
Buying: May become profitable after confirmed reversal signals appear near the reversal zone.
GBP/JPY
Brief analysis:
On the short-term H1 chart of the British pound/Japanese yen pair, an uptrend has been developing over the past month. Following last week's corrective decline from the upper boundary of a strong potential reversal zone, an upward segment with reversal potential is developing. Once confirmed by a corrective segment, the direction of price movement will change to upward.
Weekly forecast:
At the beginning of the week, the overall sideways movement is likely to continue, with the price moving along the support zone. Closer to the weekend, the probability of increased volatility and a change in direction toward a bullish move will rise. A brief move below the lower boundary of the zone cannot be ruled out. The reversal may coincide with the release of important economic data.
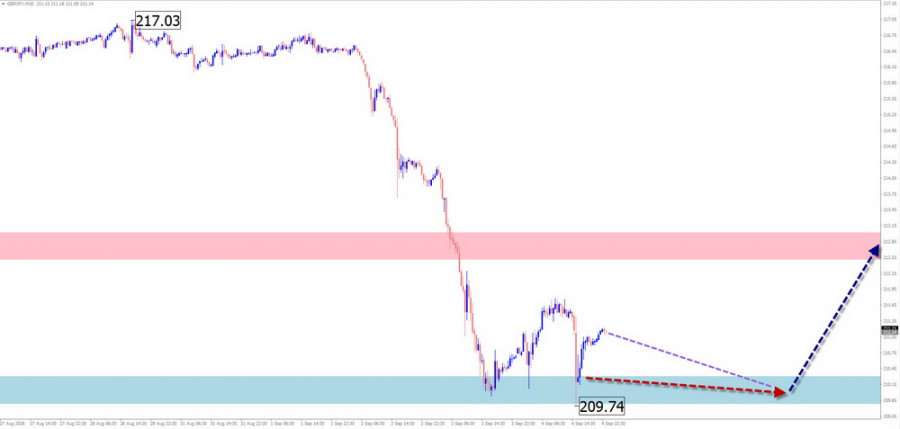
Potential reversal zones
Resistance:
- 212.50/213.00
Support:
- 210.30/209.80
Recommendations
Selling: Carries a high degree of risk and may result in losses.
Buying: May be considered after reversal signals appear near the calculated support zone.
USD/CAD
Brief analysis:
The Canadian dollar against the US currency has continued to move downward over the past six months. Over the past month, the price has been forming a flat corrective segment. The wave structure is missing its final segment.
Weekly forecast:
At the beginning of the coming week, sideways movement can be expected. A decline is possible, but no further than the boundaries of the calculated support zone. After that, a change in direction can be expected in this zone, followed by a rise toward the resistance zone. The highest volatility is expected closer to the weekend.
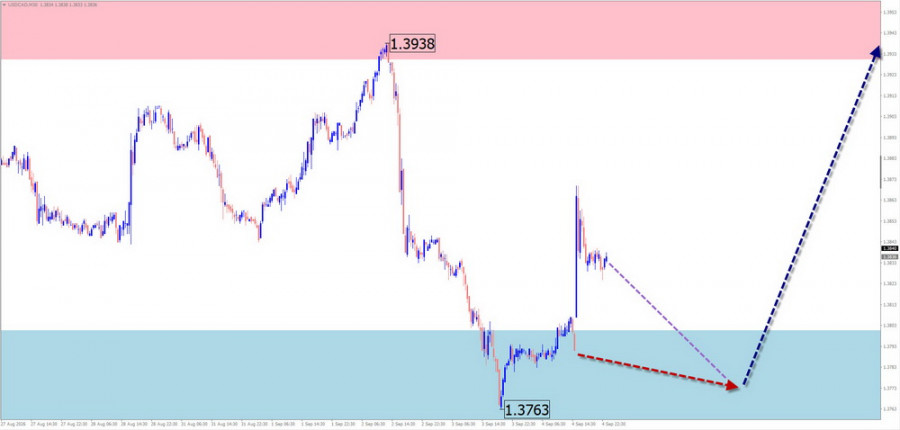
Potential reversal zones
Resistance:
- 1.3930/1.3980
Support:
- 1.3800/1.3750
Recommendations
Selling: Has limited potential. Trades may be profitable on an intraday basis using reduced position sizes.
Buying: There are no conditions for buying until confirmed reversal signals appear near the support zone.
NZD/USD
Brief analysis:
Since June this year, the kiwi has continued to move within an upward flat pattern. On a higher time frame, this segment forms part of a correction, which remains incomplete at the time of analysis. The latest unfinished upward segment with reversal potential began on September 2. The major's price is confined to a narrow range between zones pointing in opposite directions.
Weekly forecast:
In the first few days, the bullish direction is likely to continue, with the price rising toward the resistance boundaries. A change in direction can be expected in the second half of the week. The support zone indicates the lower boundary of the pair's expected weekly range. A resumption of the upward move can be expected as early as next week.
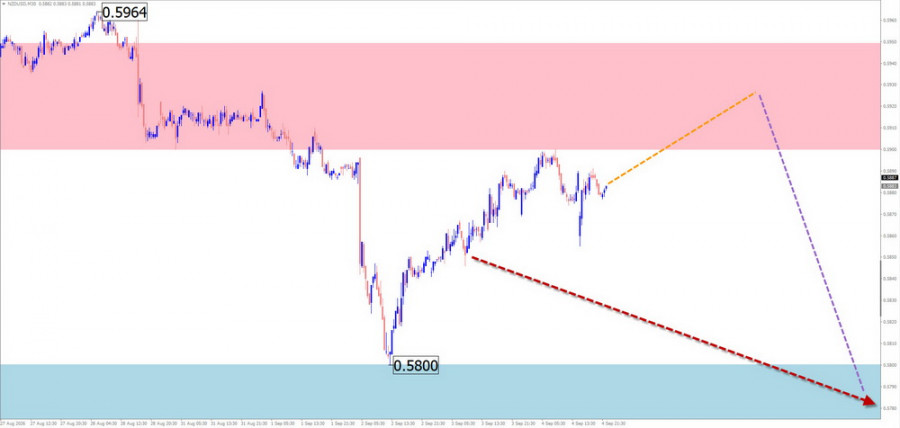
Potential reversal zones
Resistance:
- 0.5900/0.5950
Support:
- 0.5800/0.5750
Recommendations
Buying: There will be no conditions for buying in the coming days.
Selling: May be considered with reduced position sizes after confirmed reversal signals appear near the resistance zone.
GOLD
Brief analysis:
In the short term, gold prices have been forming a flat pattern on the chart since mid-August, with the price moving mainly sideways. This entire segment forms a correction of the preceding uptrend segment. At present, the wave structure most closely resembles a running flat without a final segment.
Weekly forecast:
At the beginning of the week, sideways movement in gold prices is the most likely scenario. A decline toward the support zone levels is possible. Subsequently, conditions for a reversal and resumption of the rise in gold prices may develop. The upper boundary of the expected weekly range is indicated by the calculated resistance zone.
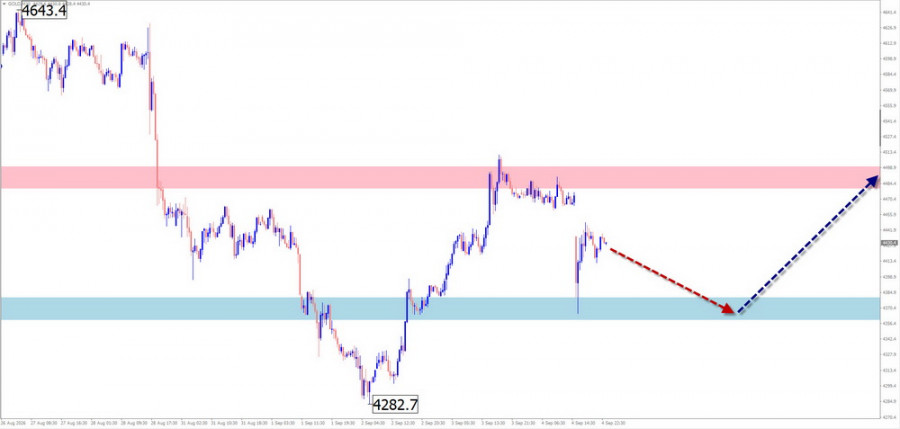
Potential reversal zones
Resistance:
- 4480.0/4500.0
Support:
- 4380.0/4360.0
Recommendations
Selling: Carries a high level of risk; it is safer to use reduced position sizes.
Buying: Will become relevant after confirmed signals from your trading systems appear near the support zone.
Bitcoin
Brief analysis:
The direction of Bitcoin's short-term trend has been determined by a downward wave since mid-August this year. Over the past week, an unfinished corrective segment of this wave has been forming. The price is approaching the upper boundary of a potential reversal zone on the daily time frame.
Weekly forecast:
In the coming days, the most likely scenario is a continuation of the upward move until the price reaches the boundaries of the resistance zone. A reversal is then highly likely. A decline in the price can be expected at the end of the current week or during the following week.
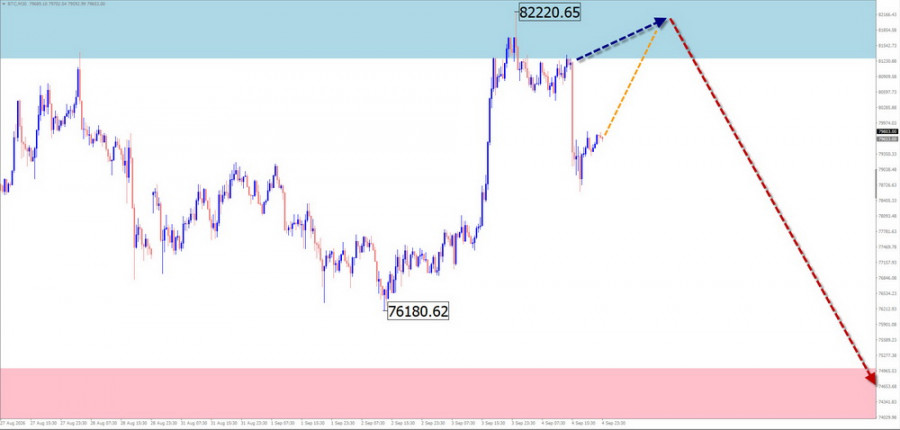
Potential reversal zones
Resistance:
- 81300.0/82300.0
Support:
- 75000.0/74000.0
Recommendations
Selling: May be used with reduced position sizes during individual trading sessions. The potential is limited by the support zone.
Buying: Will become relevant after corresponding signals from your trading systems appear near the support zone.
Explanations: In simplified wave analysis (SWA), all waves consist of three parts (A-B-C). In each time frame, the latest unfinished wave is analyzed. Expected movements are shown with a dashed line.
Attention: The wave algorithm does not take into account the duration of an instrument's movements over time.
The material has been provided by InstaForex Company - www.instaforex.comTrading Recommendations for Bitcoin (BTC/USD) on September 7 Using the ICT System
07.09.2026
Bitcoin rose by $18,000 in just a few days, but then entered a flat phase. This may be a pause before a new surge — Bitcoin often halts within strong trends and then can resume a powerful move even without a clear correction. Therefore, Bitcoin's current inability to continue growth does not mean the local upward momentum is over. Recall that neither Ether nor Bitcoin have yet broken the downtrends that began last year, so the current upward impulse should be considered local. Note also that a flat has formed on the 4-hour TF, and on the daily TF there is a high probability of a flat between $60,000 and $82,500. Additionally, on the daily TF, Bitcoin may take liquidity from the May 6 high and work the nearest bearish FVG without breaking the downward structure. In our view, the technical picture remains firmly bearish.
This week the US will publish the August inflation report, the last major release before the Federal Reserve meeting. Bitcoin's dynamics and investor appeal still depend on Fed monetary policy — a looser policy is generally better for risk assets. Currently, talk of cutting the key rate is absent; at the same time, the market has been anticipating tightening for three months, which is not favorable for Bitcoin. We assess the likelihood of a Fed hike as low. We believe the US labor market is not in great shape and the US economy has been slowing for several quarters. Last week, Christopher Waller and John Williams said they see no reason to tighten policy. Thus we view the odds of a September Fed hike as low.
Inflation data can increase or decrease those odds. If CPI on Friday prints above expectations, it would raise the probability of hawkish actions later this year; if not, it won't. The Middle East conflict persists, so we do not expect US inflation to naturally return to 2% soon. The European Central Bank may raise rates again this week in its fight against inflation.
General BTC/USD structure on 1D
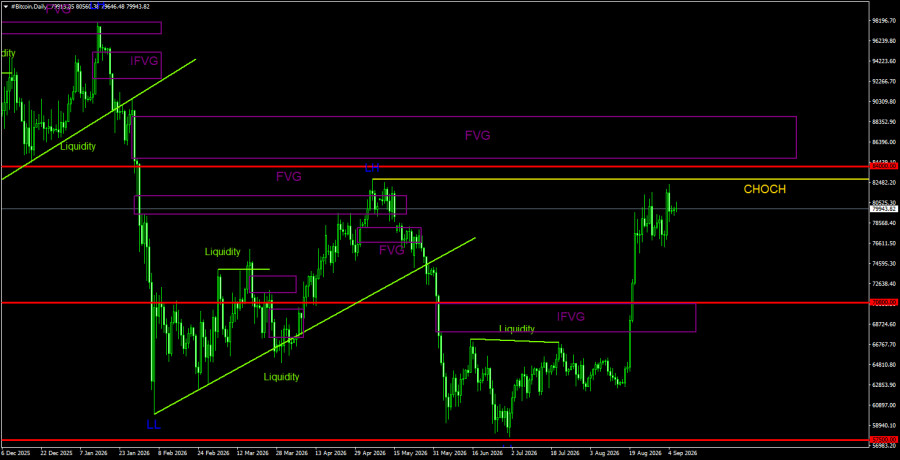
On the daily timeframe, Bitcoin continues forming a downtrend. The trend structure is bearish, and the CHOCH line sits at $82,800, where the last Lower High (LH) formed. Only above this level can the downtrend be considered complete. The last and only bearish FVG was pierced, turning into a bullish IFVG; thus, that area may serve as a POI for longs in the future. Bitcoin has not yet broken the downtrend, but over the past three weeks the odds of the bearish trend ending have increased. There is a high probability of a flat between $60,000 and $82,500, which means price could take liquidity from the last LH and then start a new decline.
General BTC/USD structure on 4H
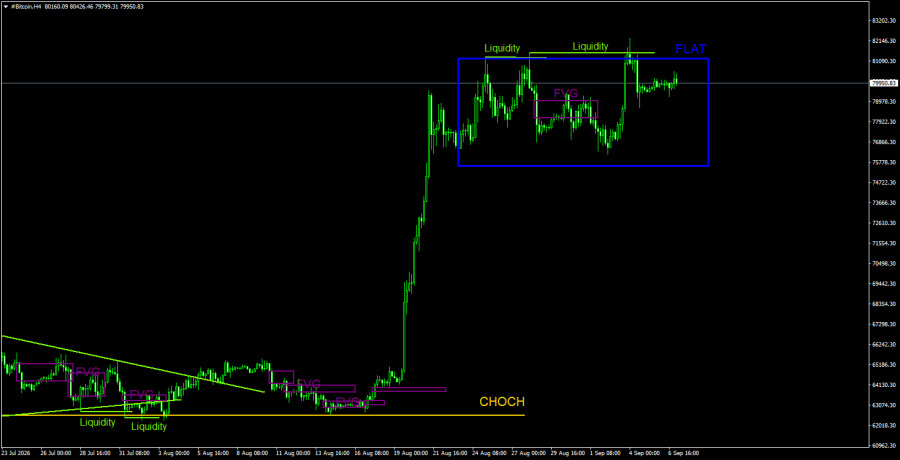
On the 4-hour timeframe, Bitcoin is in a clear flat and has twice taken liquidity to the sell side, forming two deviations of the channel's upper boundary. Traders therefore received at least two sell signals, allowing for the expectation of a decline with targets at 50% and 100% of the sideways channel width. After two deviations of the upper boundary, we would say the probability of a new strong drop is higher than a breakout of the flat to the upside. However, the latest leg up was an obvious pump, so traders must not forget to use a stop-loss.
Trading recommendations for BTC/USD
Bitcoin continues to form a downtrend despite last week's strong rally. We continue to expect a decline with a target of $57,500 (the 61.8% Fibonacci retracement of the three-year uptrend), although this level has effectively already been tested. We do not consider the downtrend finished. The current rise in the top crypto looks little like a corrective move and therefore is not a strong argument for opening longs. The move resembles a pump. Liquidity could be taken from the $82,850 high, potentially triggering a new leg of the downtrend. On the 4-hour TF, another fall may follow the second liquidity grab at recent highs (deviation).
Explanations of the Illustrations:
- CHOCH — Change of Character (break in trend structure).
- Liquidity — liquidity, stop losses, pending orders that market makers use to accumulate positions.
- FVG — Fair Value Gap, an area of price inefficiency; price moves quickly through such areas, indicating one side was absent; later price often returns and reacts to these areas in the continuation of the main trend.
- IFVG — Inverted Fair Value Gap. After returning to such an area, price may not react and instead impulsively break and then test it from the other side.
- OB — Order Block. A candle where a market maker opened a position to collect liquidity and form their position in the opposite direction.
Trading Recommendations and Trade Review for GBP/USD on September 7. The Pound Sees No Reason to Worry
07.09.2026
Analysis GBP/USD 5M
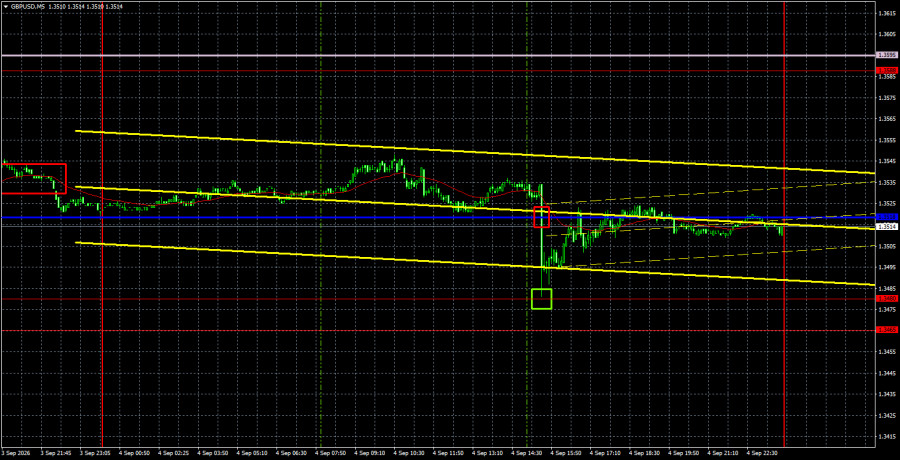
The GBP/USD currency pair showed a modest decline on Friday, triggered by very strong US Nonfarm Payrolls and a neutral unemployment rate. However, traders likely understand that when Nonfarm Payrolls exceed forecasts threefold and the previous two months are revised up, one would expect a powerful move and a strong rise in the US dollar. Instead, we saw a 50-pip rise in the dollar over about half an hour and no more. Thus the market's reaction to the report was extremely muted, and traders did not deem it necessary to buy the dollar even on such a strong and important print. This suggests traders regard the chances of a Federal Reserve rate hike in September as low. Meanwhile, the European Central Bank may deliver a real rate hike this week — its second this year. As we said earlier, while the Fed hesitates, the ECB tightens. From our perspective, the euro and the pound are more likely to resume gains than the dollar is to continue its rally. This does not guarantee sterling will rise, but its outlook for the week is quite positive.
Technically, the pound has completed the downtrend as the trendline was broken. In the near term, price may head toward the Senkou Span B line, which is the last support for bears. A break above that line would confirm a shift to an uptrend on the hourly timeframe.
On the 5-minute TF on Friday, two trading signals formed, but both were difficult to trade. First, the pair broke a critical line and then bounced from 1.3480. The first signal occurred immediately after the Nonfarm release, making it almost impossible to enter. The second signal allowed traders to capture a few dozen pips.
COT Report
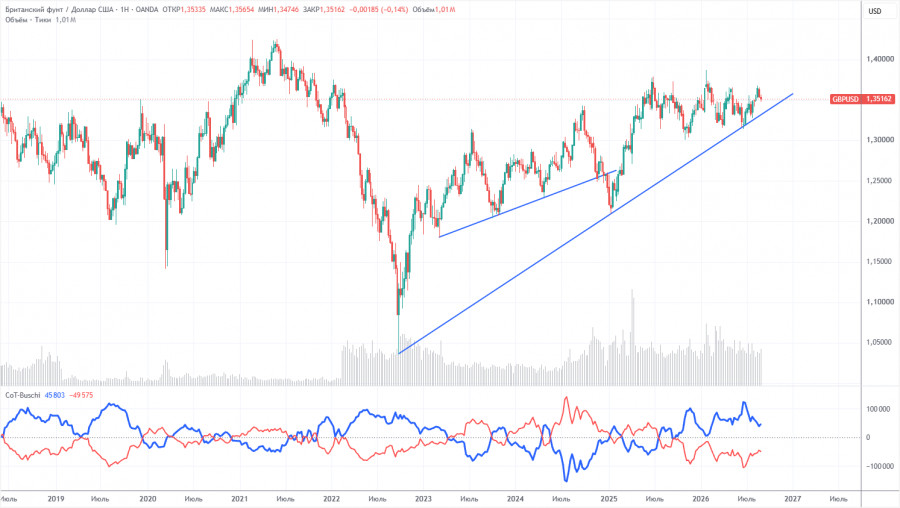
COT reports for the pound show non-commercial traders have dominated with short positions for several months. The net position is negative despite the long-term uptrend. Given events in the Middle East, high demand for the dollar in H1 2026 is unsurprising. The war is formally not over, and only geopolitics could support the dollar in the near term. However, until the pair closes below the trendline, we would not expect a strong fall.
In the long term, the dollar should continue to weaken due to Donald Trump's policies, which is evident on the weekly TF. The trade war will persist in one form or another, and Trump's policy tends to weaken the dollar. The long-term uptrend for the pound remains, as shown by the trendline. According to the latest COT (Sept 1), Non-commercials closed 8,200 BUYs and 3,100 SELLs, so the non-commercial net position decreased by 5,100 contracts that week.
Analysis GBP/USD 1H
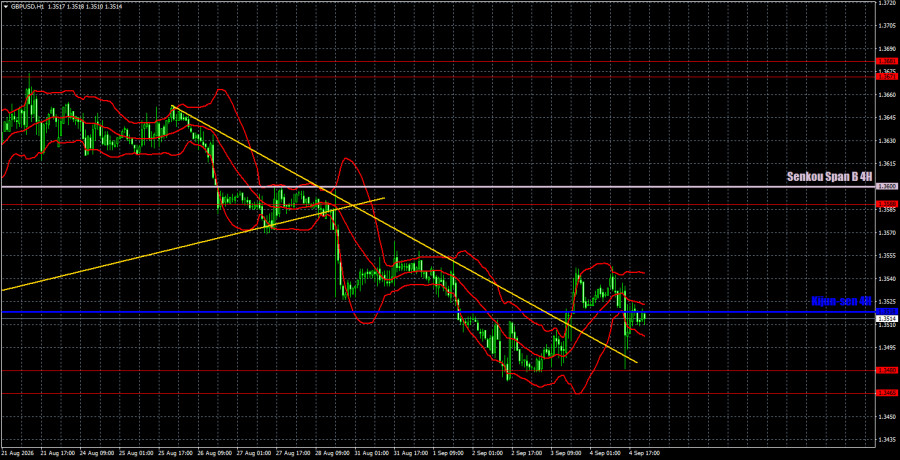
On the hourly TF, GBP/USD may begin a new upward trend. Medium- and long-term, the pound remains biased upward, so further gains would be logical. We still see no compelling reasons for prolonged dollar strength, and last week's important US reports did not provide meaningful support for the dollar.
For September 7 we highlight these important levels: 1.3042–1.3050, 1.3096–1.3115, 1.3179–1.3187, 1.3301–1.3309, 1.3369–1.3377, 1.3465–1.3480, 1.3588, 1.3671–1.3681. Senkou Span B (1.3600) and Kijun-sen (1.3518) may also supply signals. Move Stop Loss to breakeven when price moves 20 pips in the favorable direction. Ichimoku lines can shift intraday and should be accounted for when taking signals.
No major events are scheduled in the UK or the US on Monday, so expect a quiet day amid a very eventful week. Volatility may be low.
Trading recommendations:
Today, traders may open short positions targeting 1.3369–1.3377 if price holds below the 1.3465–1.3480 area. Long positions can be opened on a bounce from 1.3465–1.3480 targeting 1.3588–1.3600.
Explanations for the illustrations:
- Price support and resistance levels (resistance/support) — thick red lines near which movement may end. They are not sources of trading signals.
- Kijun-sen and Senkou Span B — Ichimoku lines transferred to the hourly TF from H4. They are strong lines.
- Extremum levels — thin red lines from which price previously rebounded; they are sources of trading signals.
- Yellow lines — trendlines, channels, and other technical patterns.
- Indicator 1 on COT charts — net position size for each trader category.
Trading recommendations and trade review for EUR/USD on September 7. Verdict for the dollar?
07.09.2026
Analysis EUR/USD 5M
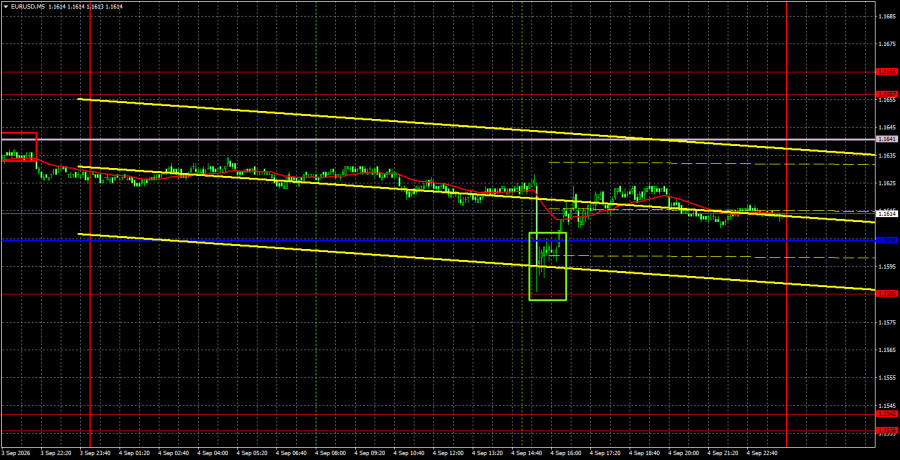
The EUR/USD currency pair once again had strong chances of continuing to decline on Friday, but the euro avoided that outcome. Briefly recall that last week, during the first three days, macroeconomic data favored the euro, yet the dollar rose the whole time — moderately and slowly. On Thursday and Friday, the US released a strong ISM services index, Nonfarm Payrolls three times higher than forecasts, and a neutral unemployment rate. And all the dollar managed in those two days was a 20-pip decline. How is it possible that with such strong support the dollar failed to strengthen? We believe the market has already adjusted in reality to selling the US currency, and confidence in Federal Reserve tightening has evaporated. Throughout 2026, we have repeated the same point: the dollar has only one supporting factor — geopolitics. That factor has an expiration date that has long passed. The market cannot keep buying the US currency for years while the Middle East conflict continues. Capital flight has already occurred; there is nothing left for the dollar to rely on.
Technically, the pair has completed the downtrend, as evidenced by the break of the trendline. However, Senkou Span B has not yet been breached, so in theory the dollar's rise could still resume. This week, the dollar's direction will depend on the inflation report, which is also due on Friday. Thus, for the third consecutive week, the dollar's fate will be decided on Friday.
On the 5-minute TF on Friday, exactly one trading signal formed. After the Nonfarm release, the price plunged by about 50 pips, allowing it to test the 1.1585 Kijun-sen area. A rebound from this area allows a new phase of growth to begin this week, unless the US inflation report signals an acceleration.
COT report
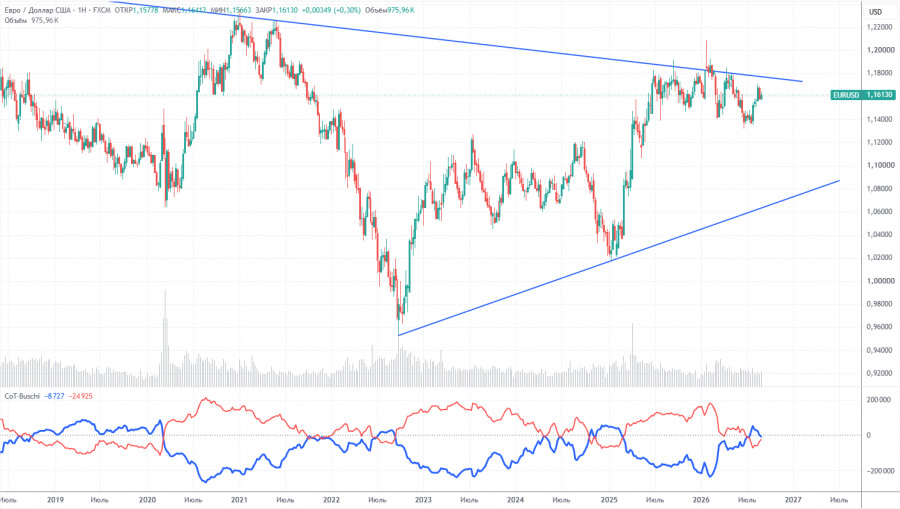
The latest COT is dated September 1. On the weekly TF, it is clear that non-commercial traders' net position turned bearish and fell significantly in 2026 due to geopolitical events. Traders have been trimming euro exposure in favor of the US dollar over the past six months. Trump's policy has not changed, but the dollar has, for a time, acted as the "reserve currency."
However, we still see no fundamental factors for further dollar strengthening. The Middle East war made the dollar temporarily super-attractive, but when that factor expires, everything will return to normal — and that expiration may already have occurred. In the long term, the euro could fall to 1.08 (trendline), but the uptrend will remain relevant. After recent months of dollar strength, the pair has not approached that trendline much.
The red and blue COT lines indicate approximate parity between bulls and bears. During the last reporting week, Non-commercial longs rose by 4,500 while shorts fell by 6,900. Accordingly, the net position increased by 11,400 contracts for the week.
Analysis EUR/USD 1H
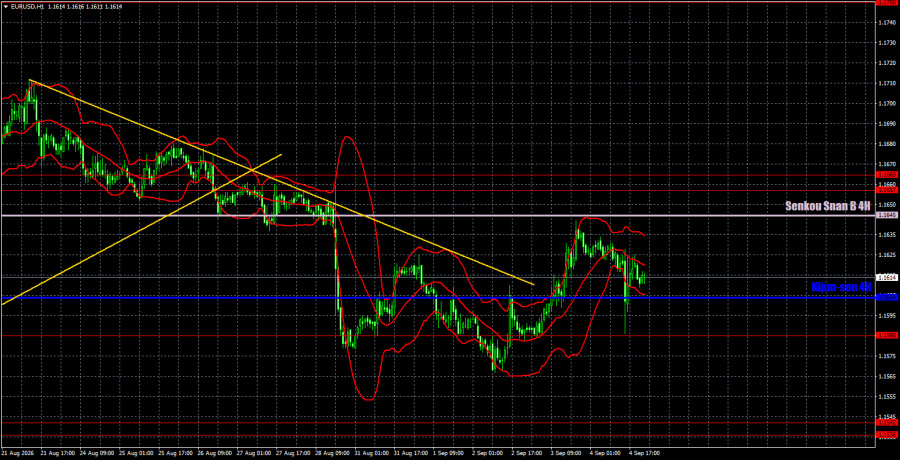
On the hourly TF, EUR/USD may begin a new upward trend. The situation in the Middle East remains tense and is not improving, but that alone is insufficient to trigger a new strong-dollar rally. Kevin Warsh's remarks and the annual Nonfarms supported the dollar, but we see no compelling reasons for optimism about the US currency. A break above Senkou Span B would open the way up for the euro.
For September 7 we highlight the following trading levels — 1.1234, 1.1274, 1.1362–1.1368, 1.1461–1.1473, 1.1536–1.1542, 1.1585, 1.1657–1.1665, 1.1750–1.1760, 1.1786, 1.1830–1.1837, and the Senkou Span B (1.1645) and Kijun-sen (1.1604) lines. Ichimoku lines can shift during the day, which should be considered when taking signals. Move Stop Loss to breakeven if price moves 15 pips in the favorable direction to protect against false signals.
On Monday, the EU will publish the third estimate of Q2 GDP, and Germany will release industrial production data. We consider both secondary and expect little market reaction. Volatility may again be muted.
Trading recommendations:
Today traders may consider short positions targeting 1.1536–1.1542 if price holds below the Kijun-sen line. A rebound from the 1.1585–1.1604 area allows opening long positions targeting 1.1645 and 1.1657–1.1665.
Explanations for the illustrations:
- Price support and resistance levels (resistance/support) — thick red lines near which movement may end. They are not sources of trading signals.
- Kijun-sen and Senkou Span B — Ichimoku lines transferred to the hourly TF from H4. They are strong lines.
- Extremum levels — thin red lines from which price previously rebounded; they are sources of trading signals.
- Yellow lines — trendlines, channels, and other technical patterns.
- Indicator 1 on COT charts — net position size for each trader category.
GBP/USD Overview. September 7. Here we go: US inflation
07.09.2026
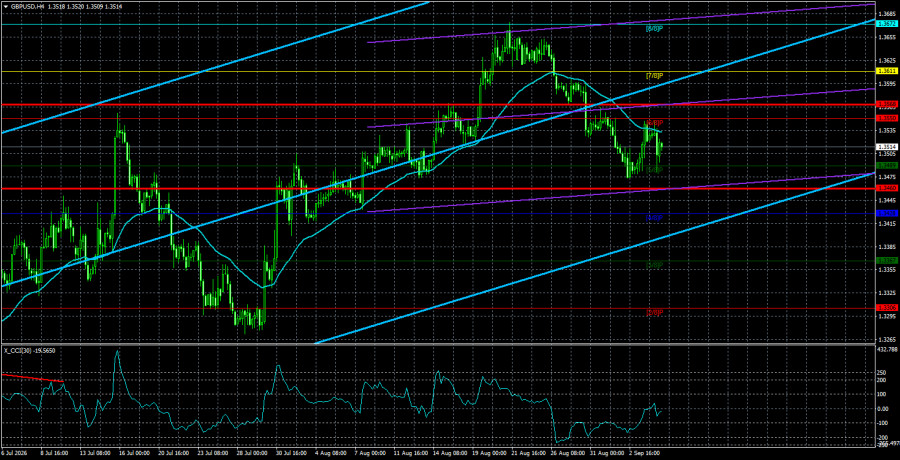
The GBP/USD currency pair on Friday failed to show either volatility or interesting moves. The Nonfarm Payrolls report "didn't work." Traders expected a significant move in either direction and answers on Federal Reserve monetary policy. In practice, nothing of the sort happened: no answers, no moves. The day's volatility was 67 pips, even less than the previous day.
In essence, the Nonfarm report changed nothing. A single report cannot alter the overall state and dynamics of the labor market. Recall that in January 2026, 160,000 jobs were created, while in February employment fell by 160,000... In March, 214,000 jobs were created; 63,000 in May, 31,000 in June, and 21,000 in July. Thus, one positive report does not change the broader picture.
Since the market received no clear answers, attention shifted to this week's US inflation report. Traders will have to wait until the last business day for answers again. Unfortunately, next Friday may also fail to provide clarity. Consensus forecasts assume US inflation in August will remain unchanged at around 3.4%. What conclusions can be drawn from that number? The slowdown in CPI has halted, and prospects remain unclear. If the conflict in the Middle East ends, inflation will resume its decline. If escalation and geographic spread occur, inflation will rise again. So a US inflation reading near 3.4% would not change Fed policy prospects.
The Fed still will not rush to hike the key rate because the labor market remains weak. The Fed will also not hurry to tighten because inflation is slowly falling. Kevin Warsh is still unlikely to be eager to raise rates as Donald Trump continues pressuring the Fed. As recently as Friday, the US president said that if the Fed refuses to cut rates, he will stop trade with countries running trade surpluses with the US. Again: Trump demands lower rates while the market expects... a hike?
Remember that Warsh is not Jerome Powell. Perhaps someday Warsh will distance himself from the White House, but to reach that conclusion he must demonstrate independence from the president. When he does, the market will understand that decisions are based solely on macro data. Until Warsh proves that independence, we remain of the view that Fed policy depends more on Trump than on inflation or the labor market.
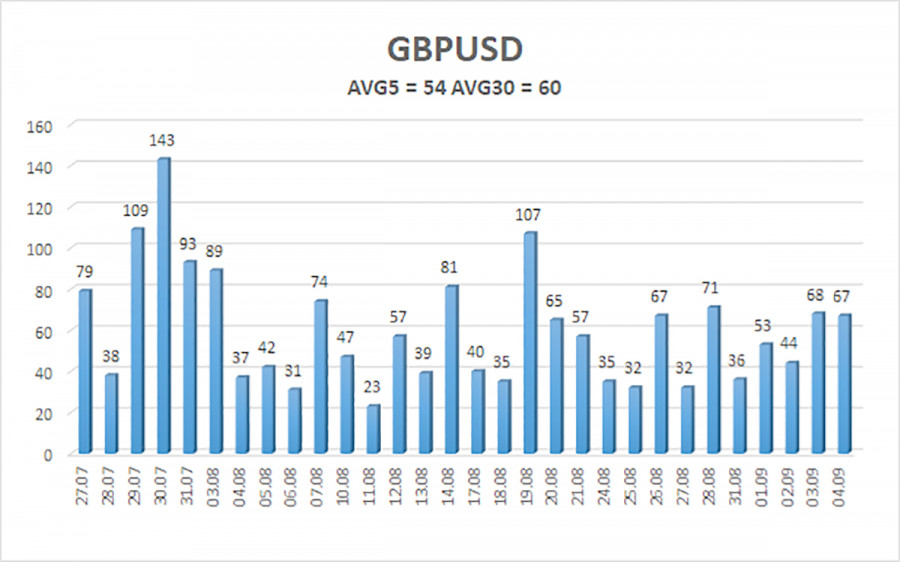
Average volatility of the GBP/USD pair over the last 5 trading days is 54 pips. For the pound/dollar, this value is "low." On Monday, September 7, we therefore expect movement within a range bounded by 1.3460 and 1.3568. The major linear regression channel has turned up, indicating an uptrend. The CCI indicator entered oversold territory, warning of a possible end to the correction.
Nearest support levels:
S1 – 1.3489
S2 – 1.3428
S3 – 1.3367
Nearest resistance levels:
R1 – 1.3550
R2 – 1.3611
R3 – 1.3672
Trading recommendations:
The GBP/USD pair retains an upward trend. Trump's policies will continue to pressure the US economy, so we do not expect long-term dollar strength. 2026 has been positive for the dollar due to geopolitics, but all stories end. On the weekly timeframe, the pair remains flat between 1.3150 and 1.3780 within a four-year uptrend, allowing for the expectation of continued pound gains in the medium term. Long positions with targets at 1.3611 and 1.3672 can be considered when price is above the moving average. Price below the moving average allows short positions with targets at 1.3460 and 1.3428.
Explanations for the illustrations:
- Linear regression channels help identify the current trend. If both are aligned, the trend is strong.
- The moving average line (settings: 20, 0, smoothed) defines the short-term trend and the direction to trade.
- Murray levels are target levels for moves and corrections.
- Volatility levels (red lines) indicate the likely price channel for the next day based on current volatility.
- The CCI indicator entering oversold territory (below -250) or overbought territory (above +250) signals an approaching trend reversal.
What to Watch on September 7? Review of Fundamental Events for Beginners
07.09.2026
Review of macroeconomic releases:
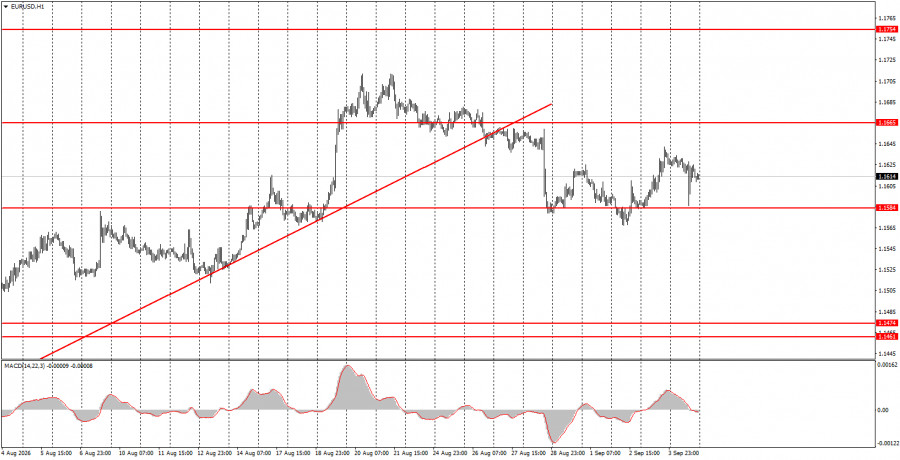
Very few macroeconomic publications are scheduled for Monday, and none of them are truly important. Germany will publish an industrial production report and the EU will release the third estimate of Q2 GDP. Industrial production is expected to grow, but the sector has faced serious problems for about five years. EU GDP may rise 0.4% month-on-month and 1.0% year-on-year, which is hardly a major achievement. Therefore, market reaction to these data may be very weak, and they are unlikely to provide strong support to the euro.
Review of fundamental events:
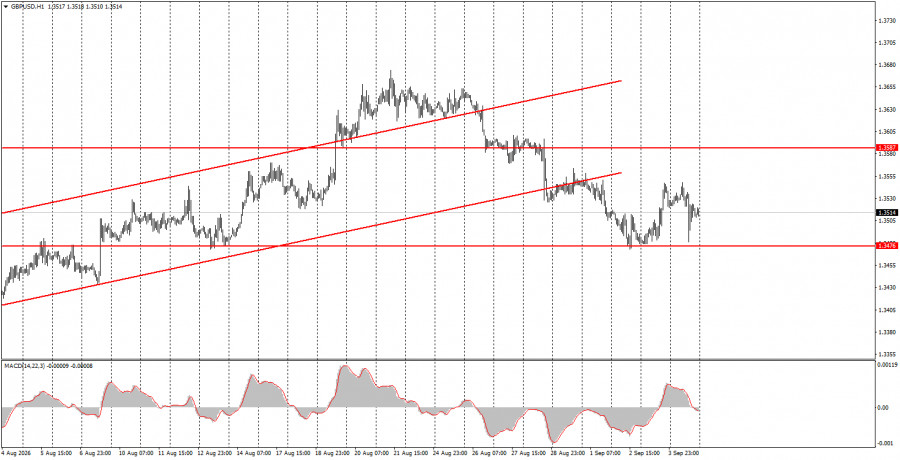
There is nothing noteworthy among Monday's fundamental events. The market remains puzzled about what the Federal Reserve will decide in September. This week, at least two members of the Monetary Committee said there are no grounds for tightening policy. But next week, US inflation data will be published, and grounds for action could emerge. In general, the situation remains contradictory and uncertain. We believe the key rate will not change.
The geopolitical backdrop still leaves much to be desired. The US and Iran are not conducting negotiations at present; the Strait of Hormuz remains closed or partially closed, and Yemeni Houthis continue to blockade Saudi Arabia. Donald Trump has decided to pursue an unprecedented economic operation to destroy Iran and threatens sanctions against any countries interacting with it. However, so far no one has supported Trump's plan to destroy Iran, and whether it will be implemented is unknown. What is known is the first US attacks in a month on launch sites near the Strait of Hormuz. Iran responded with an announced military operation against the US and its regional allies. Tensions in the Middle East are heating up again.
General conclusions:
During the first trading day of the week, currency pairs may return to their usual dynamics. The euro can be traded today from the 1.1584–1.1594 area, and the pound from the 1.3456–1.3476 area. In general, the decline of the euro and the pound may continue on corrective grounds. Still, central bank meetings are approaching, and the market increasingly doubts the Fed will tighten policy. That is the key factor supporting the dollar at the moment.
Key Rules of the Trading System:
- The strength of a signal is determined by the time it takes to form the signal (rebound or breakout). The less time taken, the stronger the signal.
- If two or more trades were opened at a certain level based on false signals, all subsequent signals from that level should be ignored.
- In a range (flat), any pair can generate many false signals or may not produce any at all. Technical levels may be disregarded.
- On the hourly timeframe, trading signals from the MACD indicator should be acted upon only when volatility is high, and a trend line or trend channel confirms the trend.
- If two levels are positioned too close to each other (within 5-20 pips), they should be considered a support or resistance area.
- After moving 15 pips in the right direction, a stop-loss should be set to break even.
What to Look for on the Charts:
Price levels (areas) of support and resistance are levels that serve as targets when opening buy or sell trades, or as sources of signals.
Red lines indicate channels or trend lines that illustrate the current trend and show the preferred direction for trading.
The MACD indicator (14,22,3) — the histogram and signal line — is an auxiliary indicator that can also be used as a source of signals.
Important speeches and reports (contained in the news calendar) can significantly influence the movement of currency pairs. Therefore, during their release, trading should be approached with utmost caution, or traders should exit the market to avoid sudden reversals against the preceding movement.
Beginner forex traders should remember that not every trade can be profitable. Developing a clear strategy and practicing money management are key to long-term success in trading.
The material has been provided by InstaForex Company - www.instaforex.comHow to Trade the GBP/USD Currency Pair on September 7? Simple Tips and Trade Review for Beginners
07.09.2026
Trade review of Friday:
1H chart of the GBP/USD pair
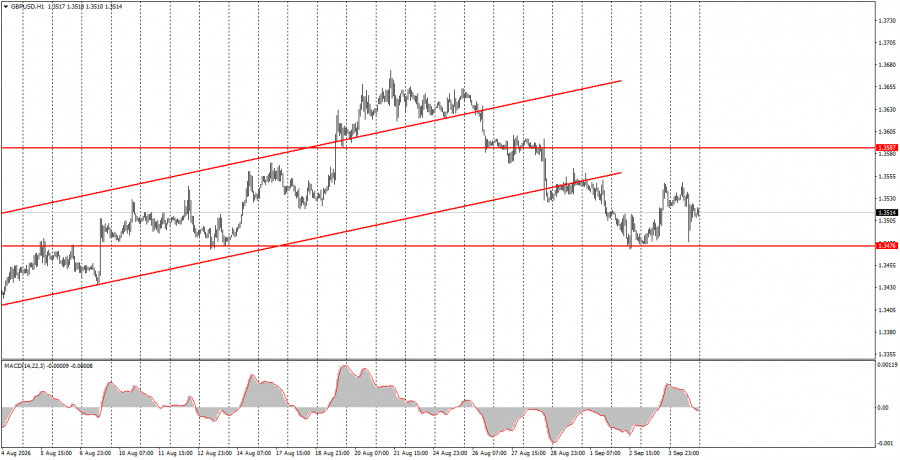
The GBP/USD pair also showed movements on Friday that traders could not reasonably expect. The situation is simple. If the Nonfarm Payrolls report prints a strong reading (above forecasts), one would expect a powerful rise in the US dollar. If the Nonfarm report prints weak numbers, one would expect the dollar to fall. In the end, we saw neither. The NFP value was three times higher than the most optimistic forecasts, yet the dollar gained only about 50 pips and lost most of that by the end of the day. In essence, the dollar did not rally when it had every reason to, and the market reaction to this major report was weak. The main point is that the market has not yet resolved whether the August NFP will prompt the Federal Reserve to raise rates in September. On the one hand, the report was strong; on the other hand, it is only one data point.
5M chart of the GBP/USD pair
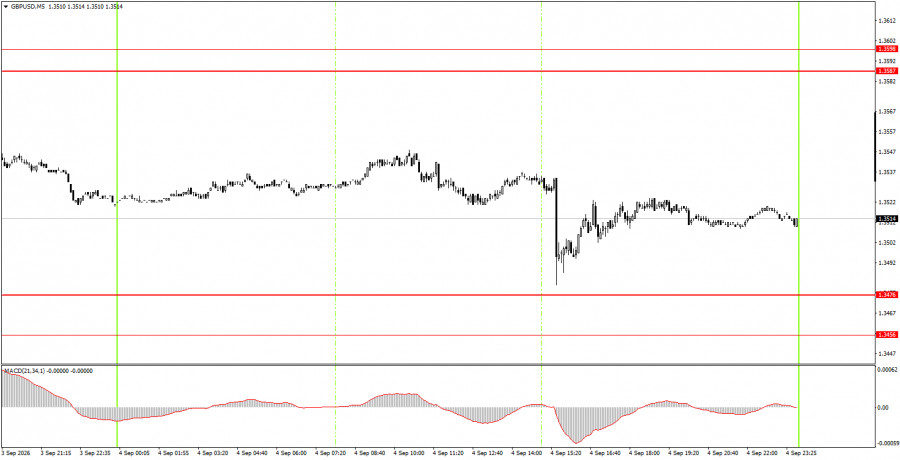
On the 5-minute TF on Friday, no trading signals were generated. During the US session, the pair could have reached the 1.3456–1.3476 area after the US data release but missed by about 5 pips. Therefore, there were no grounds for novice traders to open trades.
How to trade on Monday:
On the hourly TF, the GBP/USD pair continues a downward corrective trend. In our view, the pound should continue to rise in the medium term under any scenario, but right now it remains in correction. On the weekly TF, the move from the lower boundary of the lateral channel toward the upper boundary continues and may not yet be complete. Therefore, we expect a resumption of the upward impulse.
On Monday, novice traders may consider short positions targeting 1.3380–1.3386 if price holds below the 1.3456–1.3476 area. Long positions can be opened with targets of 1.3587–1.3598 in the event of a bounce from the 1.3456–1.3476 area.
On the 5-minute TF, you can trade the levels 1.3259–1.3267, 1.3319–1.3331, 1.3380–1.3386, 1.3456–1.3476, 1.3587–1.3598, 1.3631–1.3641, 1.3695, 1.3741. No major events or publications are scheduled in the US or the UK on Monday. Therefore, we do not expect strong movements on the first trading day of the new week.
Key Rules of the Trading System:
- The strength of a signal is determined by the time it takes to form the signal (rebound or breakout). The less time taken, the stronger the signal.
- If two or more trades were opened at a certain level based on false signals, all subsequent signals from that level should be ignored.
- In a range (flat), any pair can generate many false signals or may not produce any at all. Technical levels may be disregarded.
- On the hourly timeframe, trading signals from the MACD indicator should be acted upon only when volatility is high, and a trend line or trend channel confirms the trend.
- If two levels are positioned too close to each other (within 5-20 pips), they should be considered a support or resistance area.
- After moving 15 pips in the right direction, a stop-loss should be set to break even.
What to Look for on the Charts:
Price levels (areas) of support and resistance are levels that serve as targets when opening buy or sell trades, or as sources of signals.
Red lines indicate channels or trend lines that illustrate the current trend and show the preferred direction for trading.
The MACD indicator (14,22,3) — the histogram and signal line — is an auxiliary indicator that can also be used as a source of signals.
Important speeches and reports (contained in the news calendar) can significantly influence the movement of currency pairs. Therefore, during their release, trading should be approached with utmost caution, or traders should exit the market to avoid sudden reversals against the preceding movement.
Beginner forex traders should remember that not every trade can be profitable. Developing a clear strategy and practicing money management are key to long-term success in trading.
The material has been provided by InstaForex Company - www.instaforex.comHow to Trade the EUR/USD Currency Pair on September 7? Simple Tips and Trade Review for Beginners
07.09.2026
Trade review of Friday:
1H chart of the EUR/USD pair
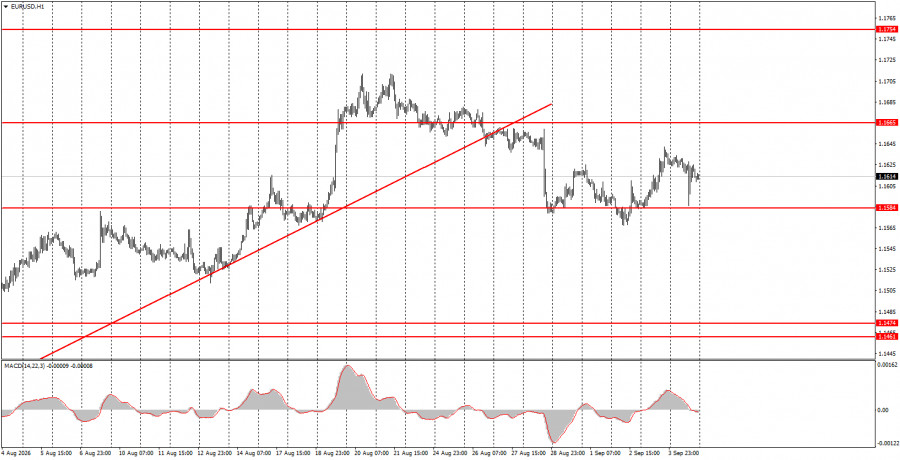
The EUR/USD currency pair showed truly paradoxical moves on Friday. For most of the week, the US dollar was in moderate strength, a trend that began last Friday under rather contradictory circumstances. Recall that the annual Nonfarm report was negative and Kevin Warsh's speech could hardly be called unambiguously "hawkish." Yet the dollar rose. From Monday to Wednesday, none of the macro reports supported the US currency, but demand for it continued to grow. On Thursday, a strong ISM services index was released and... the dollar fell by the end of the day. On Friday, the strongest Nonfarm Payrolls were released and the dollar... gained literally 15 pips. In our view, this all suggests that the current decline is a technical correction and that the market is preparing for a new rise. We still believe the probability of a Federal Reserve rate hike in September (the key market topic now) is low, so there are no solid grounds for the dollar to continue rising.
5M chart of the EUR/USD pair
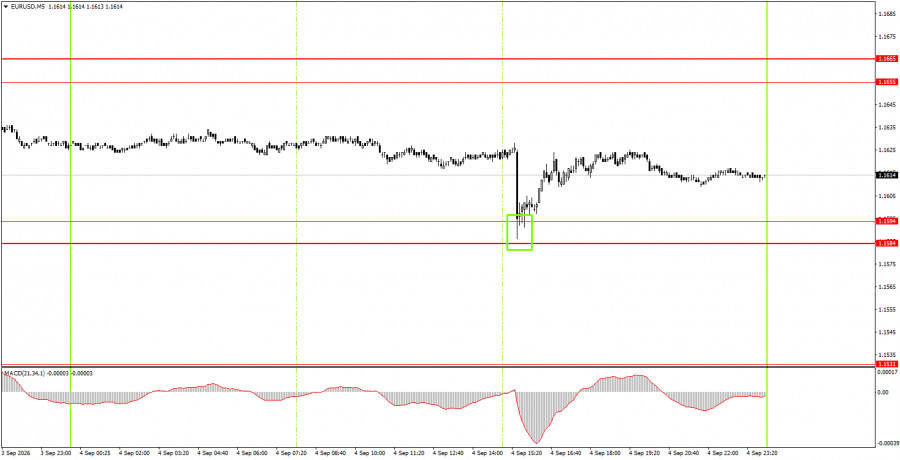
On the 5-minute TF on Friday, one buy signal formed that may continue to develop next week—at the very start of the US session, price bounced from the 1.1584–1.1594 area, allowing novice traders to open long positions. By the end of the day, those long positions could already have yielded profit. Alternatively, traders could have moved stop-loss to breakeven and waited for larger gains.
How to trade on Monday:
On the hourly timeframe, the EUR/USD pair continues a correction after a month-long rise. Taking into account all events of recent months, we believe the euro should continue to rise steadily even without local support. The US dollar currently has no growth drivers apart from the market's near-religious belief in a Fed rate hike.
On Monday, novice traders may consider short positions targeting 1.1527–1.1531 if price breaks the 1.1584–1.1594 area. Buy trades can be held with targets of 1.1655–1.1665 after a bounce from 1.1584–1.1594.
On the 5-minute TF, consider the levels 1.1366–1.1377, 1.1461–1.1474, 1.1527–1.1531, 1.1584–1.1594, 1.1655–1.1665, 1.1745–1.1754, 1.1830–1.1837. On Monday, the eurozone will publish the third estimate of Q2, GDP, and Germany will release industrial production data. These are not the most important releases, so volatility on the first trading day of the week may be low.
Key Rules of the Trading System:
- The strength of a signal is determined by the time it takes to form the signal (rebound or breakout). The shorter the time taken, the stronger the signal.
- If two or more trades were opened at a certain level based on false signals, all subsequent signals from that level should be ignored.
- In a range (flat), any pair can generate many false signals or may not produce any at all. Technical levels may be disregarded.
- On the hourly timeframe, trading signals from the MACD indicator should be acted upon only when volatility is high, and a trend line or trend channel confirms the trend.
- If two levels are positioned too close to each other (within 5-20 pips), they should be considered a support or resistance area.
- After moving 15 pips in the right direction, a stop-loss should be set to break even.
What to Look for on the Charts:
Price levels (areas) of support and resistance are levels that serve as targets when opening buy or sell trades, or as sources of signals.
Red lines indicate channels or trend lines that illustrate the current trend and show the preferred direction for trading at the moment.
The MACD indicator (14,22,3) — the histogram and signal line — is an auxiliary indicator that can also be used as a source of signals.
Important speeches and reports (contained in the news calendar) can significantly influence the movement of currency pairs. Therefore, during their release, trading should be approached with utmost caution, or traders should exit the market to avoid sudden reversals against the preceding movement.
Beginner forex traders should remember that not every trade can be profitable. Developing a clear strategy and practicing money management are key to long-term success in trading.
The material has been provided by InstaForex Company - www.instaforex.comDollar has some time to maneuver
04.09.2026
Gazing into a coffee cup is a hopeless pastime, yet that's exactly what Forex is doing ahead of the Fed meeting. A September rate hike is like a coin toss — nobody dares predict the outcome.
Formally, the dollar has some trump cards: inflation remains above target. But MUFG argues that even a rate increase is unlikely to be decisive. The ECB, Bank of England, and RBA are more hawkish than expected, and rate differentials are unlikely to swing sharply in the greenback's favor. What matters is not the fact of a hike but the signal — whether it marks the start of a cycle or is a one?off adjustment. MUFG's base case is the latter, which creates short?term upside risks for the dollar versus the euro without overturning the broader bearish view.
Treasury yields and the dollar dynamics
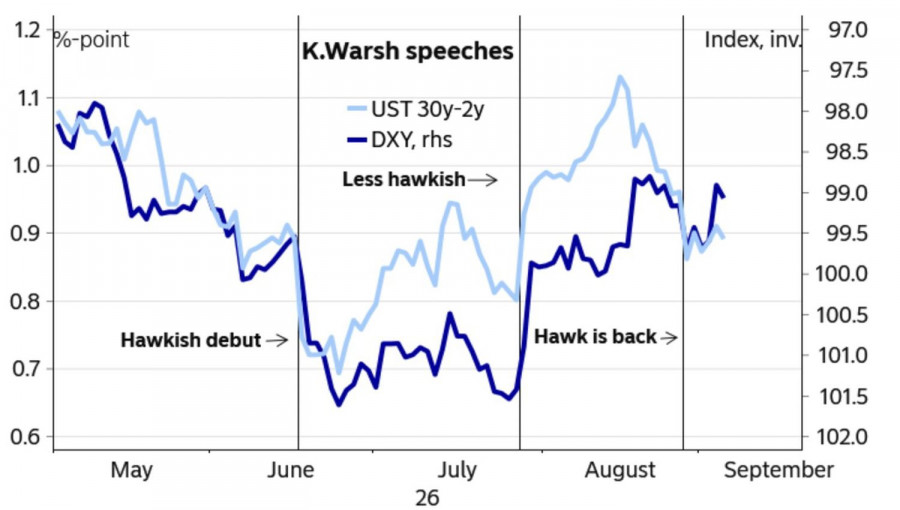
The Fed's hands are tied by more than just data. With two months until the midterm elections, large fiscal tightening is off the table. Monetary policy remains the only tool. The risk is asymmetric: if the Fed refrains from moving despite strong data, investors will demand risk premia and lose confidence, pushing yields higher and the curve steeper — as happened after July. Tightening would have avoided much of that.
The dollar's sharp slide in the first half of 2025 was a story of the narrative turning against US exceptionalism. Trade policy crowded out pro?cyclical measures, political uncertainty rose, and growth shifted toward Europe — helped materially by a German fiscal package. The dollar stabilized when the noise subsided. But structural weaknesses — fiscal outlook, term premium and trust issues — keep the bearish case for the greenback alive. In the short term, the picture is less one?sided: the eurozone is resilient and inflation there has unexpectedly picked up.
ECB rate outlook
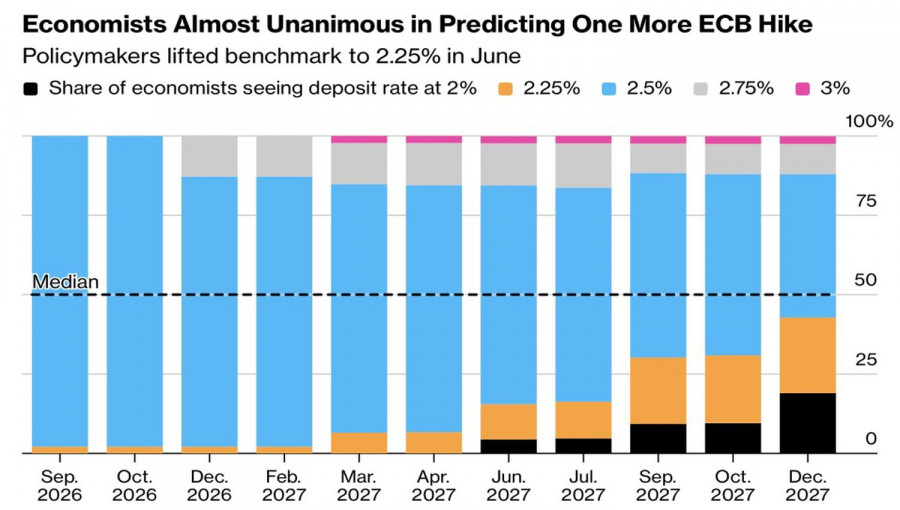
The ECB itself faces a tricky calibration. Bloomberg economists expect one hike to 2.5% followed by a pause through 2027 — a dovish scenario versus traders pricing roughly three more moves into mid?next year. The divergence is widening amid Middle East escalation: oil is moving back toward $100, and gas is rising to 2023 levels. A 25?bp step looks necessary, but it is unlikely to trigger a sustained euro rally.
ANZ notes that EUR/USD's rise above 1.17 in August reflected not just dollar weakness but eurozone resilience. GDP grew 0.4% in Q2 and PMI has been rising for months. The policy meeting on September 9–10 will bring the ECB's first projections since June; they should confirm resilience and support the euro. The risk is that the bank focuses on energy?driven disinflation and trims forecasts, which would cap the instrument's rally.
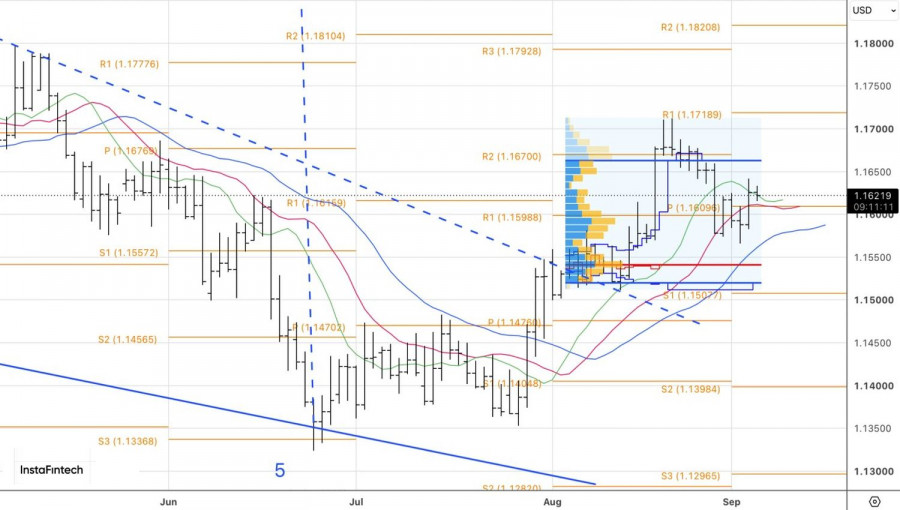
Either way, the dollar and euro are playing the same game in September under different rules — each side is waiting for the other central bank to blink first. Who will do it earlier?
Technically, on the daily chart, a break below 1.1610 in EUR/USD would be a sell signal. Conversely, a move above 1.1635 would be a buy signal.
The material has been provided by InstaForex Company - www.instaforex.comGBP/USD – Smart Money Analysis: An Unexpected Market Reaction
04.09.2026
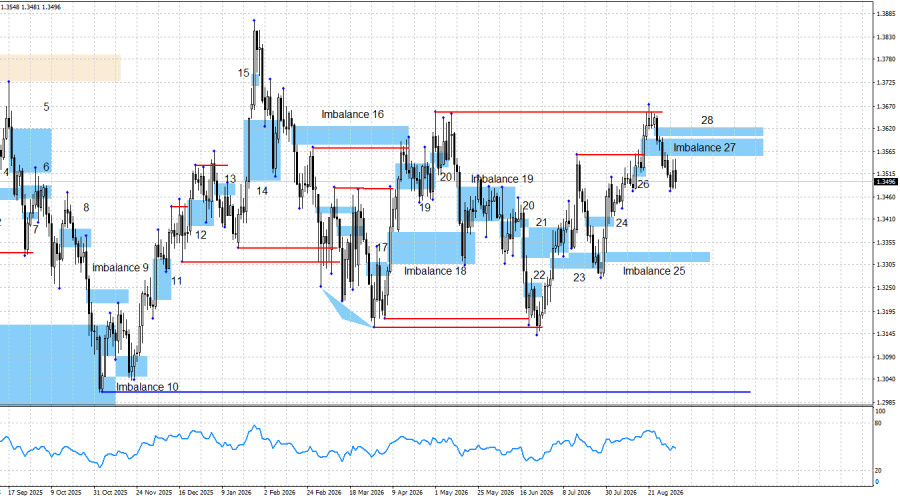
The GBP/USD pair has lost its bullish momentum, but the bullish advance is still not over. In my view, the pound's salvation lies in the hands of the euro. At present, the euro currency is still maintaining a bullish bias and has not invalidated its two latest bullish imbalances. These imbalances could save both the euro and the pound. As I said earlier, I see no reasons for the bears to launch an advance. This week, traders could observe paradoxical movements. During the first three days of the week, the dollar had no reasons to rise, but it did. On Thursday, the dollar had grounds to rise, but it fell. Today, the US currency could have risen by at least 100 points, but instead it declined by literally 10–20 points. Therefore, I cannot describe the current movements as logical, especially in the pound. I believe that the technical picture for the euro is currently more logical and informative. Despite the strong August Nonfarm Payrolls report, the overall picture in the labor market has not changed, while at least two FOMC members spoke out against changing the interest rate in the near future this week. I believe that the Fed will not tighten policy in September. If the euro currency rebounds from its two imbalances and begins an upward move, I expect the pound to rise as well, even without the formation of signals or patterns and despite the two bearish imbalances.
Over the past month, the dollar has suffered numerous setbacks, including the US Treasury's decision to increase the volume of long-term bond buybacks, weak monthly Nonfarm Payrolls reports, a weak annual Nonfarm Payrolls report, a slowdown in the Consumer Price Index, a slowdown in GDP growth, and declining market expectations for Fed monetary policy tightening. This week, the only factors supporting the dollar were the Nonfarm Payrolls report (for the first time in a long while) and the ISM Services PMI. However, at the most critical moment, the bulls retreated despite having all the cards in their hands. All that remains is to hope for the euro and for this behavior by the bulls to be temporary.
Do the bears have prospects at present? In my view, very few. As we have already established, the fundamental backdrop does not support the US dollar. However, we should not forget that not everything in the market depends solely on the fundamental backdrop. In the long term, the market has been in a range for about a year. We have seen three waves upward, and everything suggests that the bulls should continue their advance. However, over the past year, we have seen an alternation of three-wave structures and similar formations. A liquidity sweep of the swing from May 1 could provide a basis for a new bearish part, which would be completely inconsistent with the fundamental backdrop.
Geopolitics is no longer having a favorable effect on the dollar. Negotiations between the United States and Iran have failed once again and are no longer taking place. From time to time, Iran and the United States exchange strikes, threats, and ultimatums, which have no effect whatsoever on resolving the conflict or ending the war. No one can currently predict how much longer the conflict will continue. And the dollar cannot count on market support every time the two sides exchange strikes, which are occurring with notable regularity.
Technical analysis shows that within just a few days, the picture changed from bullish to bearish based on two completely ambiguous events. The euro may stop the pound's decline, but at present, the bears have two imbalances from which positions can be opened. However, the pound's decline could end at any moment if the euro fails to overcome its imbalances. In the euro-pound pair, the euro currency has the higher status.
The economic fundamental backdrop on Friday handed all the cards to the bears. The European retail sales report was weaker than market expectations, while the US unemployment and labor market reports were much stronger than forecasts or in line with them. Paradoxically, the US dollar failed to rise (as of the time of writing). If the market is now refusing to buy the dollar, this means it is not pricing in FOMC monetary policy tightening. In this case, the pound may resume its trend.
The overall fundamental backdrop remains such that, in the long term, I cannot expect anything other than a decline in the US currency. However, this decline appears to be postponed once again for some time. The war between Iran and the United States has not changed my long-term expectations. Geopolitics prompted the market to remember the dollar's safe-haven status for several months, but the conflict has already passed its most active phase. The prospects for FOMC monetary policy tightening remain ambiguous, while the market itself is constantly changing its expectations. Therefore, in my view, any rise in the dollar is temporary and random in nature. I see no reasons for a large-scale advance by the bears.
Economic calendar for the United States and the United Kingdom:
On September 7, the economic calendar contains no noteworthy events. The economic backdrop will have no impact on market sentiment on Monday.
GBP/USD forecast and trading advice:
The long-term picture for the pound remains bullish. After liquidity sweeps of the two latest swings and the formation of a series of buy signals, the bulls may still continue their advance. Unfortunately, the bears have controlled the initiative over the past week, and all the latest bullish patterns have been invalidated. The bears currently have technical grounds for an advance. Only the euro currency can save the pound. The liquidity sweep of the swing from May 1 triggered the decline, and a sell signal formed within the "inverted imbalance" 27. It is difficult to say how long the pound will continue to decline. Two bullish imbalances on EUR/USD could well stop the decline. The fact that the bears did not launch a new attack after the Nonfarm Payrolls report indicates that this report does not change the market's view of the Fed's rate decision in September.
The material has been provided by InstaForex Company - www.instaforex.comWe re-designed, to let you stay FOCUSED and relaxed (no ads) while you TRADE (no distractions). If you like our website, you can support us by hitting any button below!