
News updated
EUR/USD Review. August 25. Interesting Insight from Saudi Arabia
26.08.2026
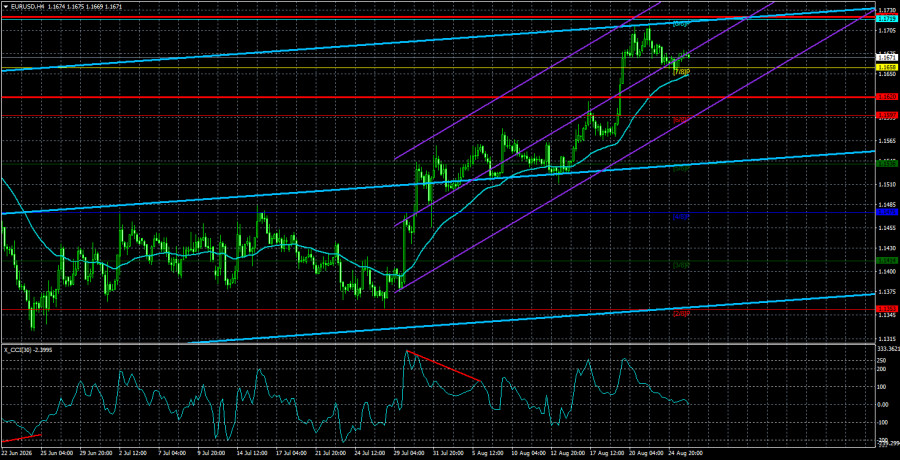
The EUR/USD currency pair showed no interesting movements on Tuesday. Essentially, low volatility should no longer surprise anyone, as since August 4 the daily figure has exceeded 63 pips only once and 46 pips four times. As a result, everyone should have grown accustomed to weak movements. On Tuesday, there were no important fundamental or macroeconomic events in the Eurozone or the U.S. Hence, traders had nothing to react to throughout the day.
Meanwhile, very interesting information has emerged from the Middle East, which the market is currently overlooking. According to Al Arabiya, the U.S. is prepared to lift the economic blockade on Iran in exchange for the reopening of the Strait of Hormuz. It is hard to say how accurate this information is, as in recent days U.S. officials have been focused on announcing new operations against Iran. Trump plans that all countries engaging in business with Iran should stop doing so, which would result in Tehran's complete economic isolation and ultimately its capitulation. In our view, none of Iran's allied countries will cooperate with the U.S., but as the saying goes, dreaming is not harmful.
Trump clearly understands that China is unlikely to stop purchasing Iranian oil just because Washington wants to strain Iran, and that he aims to declare another victory. Therefore, the White House seeks to implement various sanctions against those nations that do not support the economic blockade of Iran and continue to sponsor it. Again, it is hard to believe that Washington would engage in a new conflict with Beijing; however, one can expect anything from Trump.
Returning to Al Arabiya's insight, we can certainly accept that the information is true. This aligns with Trump's approach: first threaten, then show flexibility and make concessions. Announce new strikes against Iran, and then report that partners persuaded the American president not to do so. Thus, Washington may be genuinely ready to lift its economic isolation in exchange for the reopening of the Strait of Hormuz. But will this arrangement suit Iran? We believe not. For Iran, the Strait of Hormuz remains a key lever of pressure not only on Trump but on the entire world. Thanks to this lever, Tehran can defeat Trump and significantly diminish his influence on any state decisions. The congressional elections are approaching, and with current ratings, Trump is certainly set to lose. If he loses, he will no longer be able to unilaterally make decisions about sanctions and strikes against Iran. Therefore, there is no sense in Tehran opening the Strait of Hormuz. If Washington does proceed with the economic isolation, Iran may well also close the Bab-el-Mandeb Strait, escalating pressure on energy markets and the American electorate.
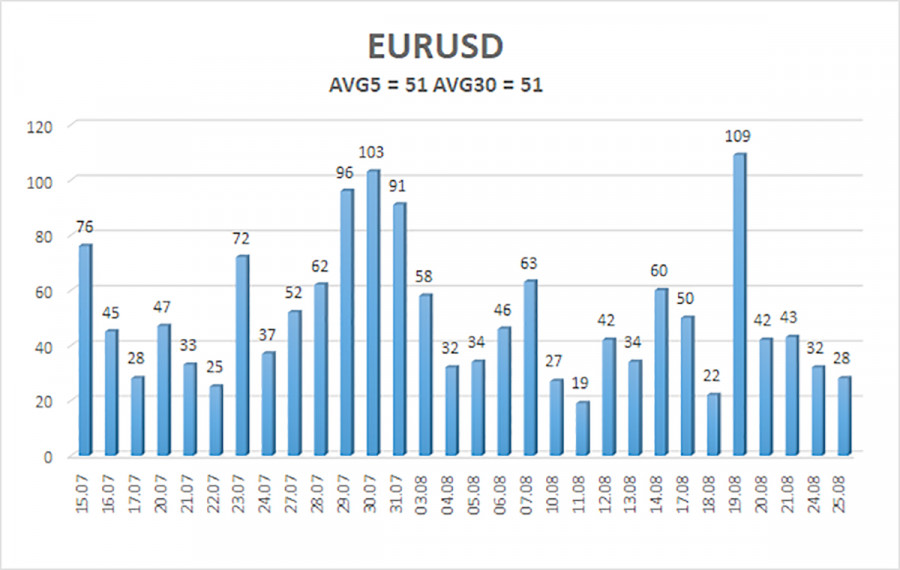
The average volatility of the EUR/USD currency pair over the past 5 trading days as of August 25 is 51 pips and is characterized as "medium-low." We expect the pair to move within the range bounded by levels 1.1620 and 1.1722 on Wednesday. The upper linear regression channel is sloping downward, indicating the continuation of the bearish trend; however, the trend has already changed. The CCI indicator has once again entered the overbought area, warning of a potential new downward pullback.
Nearest Support Levels:
S1 – 1.1658
S2 – 1.1597
S3 – 1.1536
Nearest Resistance Levels:
R1 – 1.1719
R2 – 1.1780
R3 – 1.1841
Trading Recommendations:
The EUR/USD pair continues its upward trend on the 4-hour timeframe, which may signal the beginning of a new phase in the global upward trend on higher timeframes. The global fundamental backdrop for the dollar remains negative, but in 2026, geopolitical factors, followed by a hawkish stance from the Federal Reserve, provided significant support for the American currency. However, at this time, these factors no longer support the dollar. When the price is below the moving average, short positions may be considered on a corrective basis, targeting 1.1597. Long positions remain relevant above the moving average line, with targets at 1.1719 and 1.1722.
Notes on Illustrations:
- Linear Regression Channels help determine the current trend. If both are pointing in the same direction, it indicates that the trend is currently strong.
- Moving Average Line (settings: 20, 0, smoothed) determines the short-term trend and the direction in which to trade.
- Murray Levels – target levels for movements and corrections.
- Volatility Levels (Red Lines) – the likely price channel in which the pair will trade over the next 24 hours based on current volatility metrics.
- CCI Indicator – its entry into the oversold area (below -250) or the overbought area (above +250) indicates an impending trend reversal in the opposite direction.
EUR/USD. The August IFO Indices: Another Trump Card for the Euro
26.08.2026
The EUR/USD pair remains range-bound; however, the macroeconomic balance is gradually but confidently shifting in favor of buyers. The euro currently benefits not only from the persistent weakness of American macroeconomic data but also from increasingly convincing signs of recovery in the European economy. The IFO report published on Tuesday provided further confirmation of this trend. The sequence of strong ZEW, PMI, and IFO indicators has formed a compelling picture of recovery in the European economy.

Thus, the IFO business climate index from the IFO Institute rose in August to 88.8 points, after being revised to 86.7 points in July. Most analysts had forecasted a more modest increase to 87.2. The index has shown a consistent upward trend for four consecutive months, reaching a yearly high. Moreover, the improvement was not only "quantitative" but also "qualitative," as both components of the index also exceeded expectations. The assessment of current conditions rose from 86.5 to 88.5 points, while the expectations index increased from 86.8 to 89.1 points. This is a crucial point: while in previous months the improvement in the IFO was primarily attributed to a decrease in pessimism about the future, now German companies are assessing both the current situation and prospects more favorably. This indicates a trend towards more sustainable optimism.
Another important point is that positive dynamics were recorded across all major sectors—industry, services, trade, and construction. This means the recovery is no longer limited to a single segment of the economy.
However, the IFO cannot be considered unconditionally strong in an absolute sense: the index remains notably below levels characteristic of a full-blown economic boom. Nevertheless, the direction of movement appears increasingly convincing and pronounced. It is also worth noting that the growth in indicators occurred despite a renewed rise in oil markets and energy prices.
The GDP growth data for Germany, published today, serves as supplementary confirmation of the strong signal from the IFO. The second estimate of GDP showed that the German economy grew by 0.3% quarter-on-quarter in Q2, while the initial report indicated a growth of 0.2%. The figure has remained in positive territory (0.3%) for three consecutive quarters. Year-on-year, the indicator was also in the "green zone": rather than the expected 0.9% growth, GDP increased by 1.0% (the strongest result since Q3 2022).
In this context, it's important to compare the IFO with two other significant indicators: the ZEW and the PMI. As a brief reminder, the German ZEW Economic Sentiment Index released last week rose to 34.2 points (up from 26.3), significantly exceeding the forecast (30.0). The sub-index of current conditions also improved, rising from -77.6 to -61.1. Meanwhile, the composite PMI for the Eurozone rose to 52.1 points in August (the highest since November last year), with new orders increasing at their fastest pace in more than three years, and the manufacturing PMI reached its highest level in 54 months.
The difference between these indicators is essential. The ZEW reflects the sentiment of analysts and institutional investors, serving as a kind of leading indicator for financial market expectations. In contrast, PMI is closer to real economic activity: it shows what is happening with orders, production, employment, and prices right now, in the moment.
The IFO occupies an intermediate position. This indicator covers the economy more broadly than PMI and simultaneously combines assessments of the current situation with six-month expectations. Therefore, the ZEW, PMI, and IFO do not "compete" with each other; instead, they complement each other (especially in this case). The first provides insights into how to improve expectations, the second reflects the recovery in current business activity, and the third indicates that optimism is gradually spreading to a fairly broad range of German companies.
For the European Central Bank, this is an important signal. Not long ago, the weakness of the German economy served as an argument against further tightening of monetary policy. Now, however, the situation is changing: the recovery of the German economy gives the regulator more grounds to continue tightening policy. Moreover, the Eurozone economy is growing faster than expected: GDP for the currency bloc increased by 0.4% in Q2, while inflation accelerated to 2.9% in July, with core inflation rising to 2.5%. Inflation in the services sector reached 3.3%. Unemployment in the Eurozone is at historically low levels, and July's PMI recorded its first increase in employment this year. Meanwhile, inflation expectations and high energy prices pose a risk of secondary effects through wages and prices.
According to the latest Reuters survey conducted from August 10-13, an overwhelming majority of economists (57 out of 69) expressed confidence that the European Central Bank will raise the deposit interest rate by 25 basis points.
Thus, the fundamental picture for the EUR/USD pair is shaped in favor of buyers not only by the weak Nonfarm Payrolls, sluggish retail sales, and slowing CPI and PPI in the U.S., but also by the strengthening of the euro. The ECB is getting more and more grounds for tightening its policy – at a moment when the arguments for raising the Fed's rate are gradually weakening.
The only significant obstacle to realizing this advantage remains the geopolitical agenda, which periodically returns the dollar to the status of a safe-haven asset. Therefore, in the near term, the EUR/USD pair is likely to maintain range trading within the price range of 1.1640–1.1700, the boundaries of which correspond to the upper and lower lines of the Bollinger Bands on the four-hour chart.
The material has been provided by InstaForex Company - www.instaforex.comEUR/USD, GBP/USD: What Should Traders Expect on Wednesday?
25.08.2026
On Wednesday, August 26, the economic calendar contains several fairly interesting releases. In addition, new information on the conflict in the Middle East could emerge at any time, and the situation could take a rather unusual turn in the near future.
The economic reports scheduled for Wednesday can be considered important. Therefore, traders are unlikely to ignore them, but a strong market reaction should not be expected either. Traders are already looking ahead to Friday, when Kevin Warsh is scheduled to speak and the annual Nonfarm Payrolls report will be released. Therefore, despite the importance of the PCE Index, GDP data, and durable goods orders, these releases are not currently the main factors determining market sentiment or its attitude toward the U.S. dollar. What do the forecasts indicate? The Core Personal Consumption Expenditures (PCE) Price Index could rise by 0.2% in July, GDP growth could slow to 1.5% in the second quarter, and durable goods orders could increase by 0.7%. However, I would like to remind you that forecasts are only expectations, and the actual figures may be completely different.
Geopolitical developments should also not be overlooked. A great deal of news emerges every day, and traders' main task is to distinguish relevant information from noise. Today, it became known that the economic blockade of Iran may not take place if Iran opens the Strait of Hormuz. What is this? Another attempt by Donald Trump to achieve his desired outcome? The U.S. president understands perfectly well that with the Strait of Hormuz closed, lower oil, gas, and fuel prices cannot be expected. And with high prices for all types of fuel, he cannot expect an improvement in his approval ratings ahead of the elections or greater support for Republicans among American voters.
Furthermore, implementing an economic blockade of Iran would require sanctions against China, which is the main importer of Iranian oil. Is Trump prepared to begin a new confrontation with China just two months before the elections? Especially since Beijing has already stated that any sanctions or tariffs will receive a reciprocal response. For traders, the current situation leaves little choice but to assess the possibilities and wait for further developments. Words are one thing, but they often differ from actions. By now, probably everyone has heard of the TACO principle. Therefore, Trump's threats may ultimately remain just threats. Naturally, that would be a positive development, as Iran is also prepared to respond to any new U.S. measures aimed at pressuring the country.
News Calendar for the United States, European Union, and United Kingdom:
- United States — Core Personal Consumption Expenditures (PCE) Price Index (12:30 UTC).
- United States — Change in Durable Goods Orders (12:30 UTC).
- United States — Change in Second-Quarter GDP (12:30 UTC).
- United States — Change in Personal Income and Spending (12:30 UTC).
EUR/USD Forecast and Trading Recommendations:
In my view, the pair remains in the process of forming a bullish trend. The fundamental backdrop shifted sharply in favor of the bears six months ago, but the trend itself cannot be considered canceled or complete. Therefore, the bulls may well continue their advance following two liquidity sweeps of clearly defined lows. At present, bullish traders have support in the form of Imbalance 21. A new buy signal may form this week. I see 1.1797 and 1.1850 as the targets for further gains in the euro.
GBP/USD Forecast and Trading Recommendations:
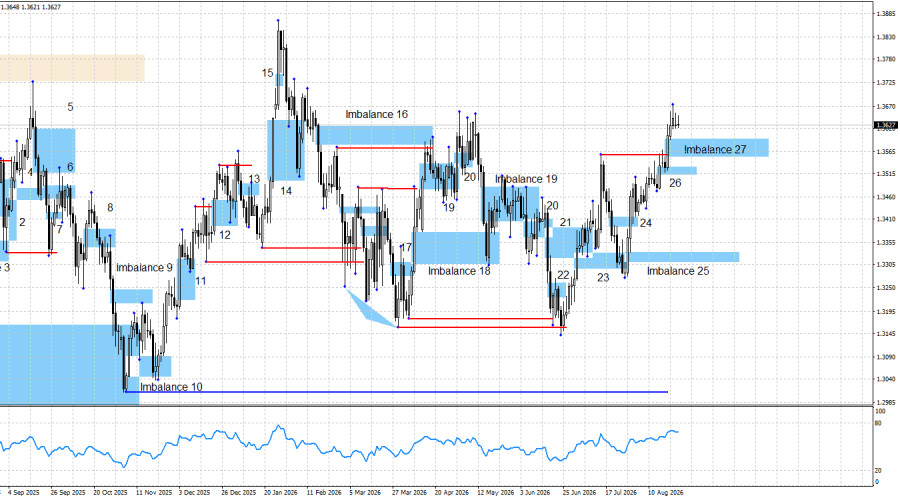
The long-term outlook for the pound remains bullish. Following liquidity sweeps of the two most recent swings and the formation of a series of buy signals, the bulls continue to advance. I currently see no basis for a bearish move, as there are no bearish patterns or signals. The bulls received a buy signal from Imbalance 24, which remains valid. Traders may already consider taking profits based on this signal. A new buy signal was formed within Imbalance 26. The current target for the pound is the January 27 high at 1.3867. A liquidity sweep of the May 1 swing could push the pound somewhat lower, but it is unlikely to disrupt the bullish advance. A bullish signal should also be expected to form within Imbalance 27.
The material has been provided by InstaForex Company - www.instaforex.comEUR/USD Analysis – August 25: The Dollar Remains Under Pressure
25.08.2026
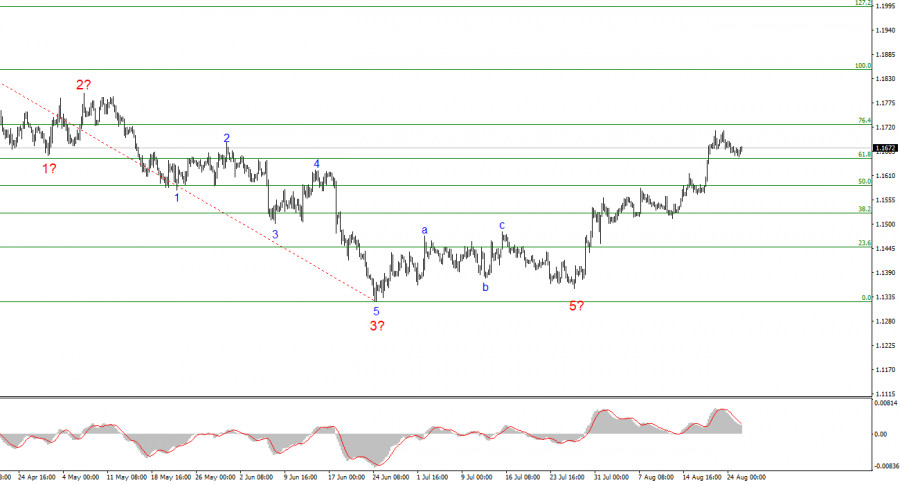
The wave count on the 4-hour chart for EUR/USD is becoming more complex. There is still no question of canceling the upward trend segment (lower chart), which began in January last year. On the contrary, we have seen a complete A-B-C corrective structure that has most likely ended. We never saw a convincing wave 5 of C. This wave took a truncated form, which also occurs from time to time. Let me remind you that classical wave structures are generally found only in textbooks. In real-world markets, traders and analysts need to be more flexible in their analysis. Therefore, I have been saying in my reviews for a month now that traders should prepare for further gains in the euro. If the current wave count is correct, the instrument is at the very beginning of a new upward trend segment.
On the lower timeframe, I can identify a classic five-wave downward structure with a truncated wave 5. I expected the euro to decline to the 13th figure, but the news turned against the dollar, and sellers simply lacked the strength to form a convincing wave 5. Therefore, the formation of a new upward wave sequence can be considered to have begun on July 28.
Secondary Data Failed to Support the Dollar
EUR/USD rose by 10 basis points on Tuesday. The trading range during the day was again limited, although the pair could still gain or lose another 10–20 basis points by the end of the day. However, a more substantial move is currently out of the question. Several reports were released in Germany and the United States today, but they generated no interest or reaction among market participants. I would put it differently: from the outset, none of these reports had any chance of attracting traders' attention. If we exclude the days when the market paused and remained largely flat, the dollar continues to decline sharply. This is particularly clear on the daily chart. Since July 27—that is, for an entire month—there has not been a single strong bearish candlestick or any movement resembling a correction. Therefore, the U.S. currency has been declining for an entire month.
I cannot say that this move was unexpected, as I have repeatedly written in 2026 that the war in Iran was the only factor that supported the dollar. In June, the Fed provided some support for the dollar, but this did not last long. Within a couple of weeks, the market began to question whether the FOMC under Kevin Warsh could deliver on its promises to bring inflation down to its target. Now it is the end of August, and the market's hawkish expectations continue to weaken. No one is expecting monetary policy tightening in September anymore, while Trump's war in the Middle East has effectively stalled. The situation has reached a complete deadlock. Neither Iran nor the United States can make a move that would improve its position. Neither side has a decisive advantage that could be used to bring the conflict to a logical conclusion. Therefore, I believe the U.S. currency could continue to decline even after a month-long fall.
Overall Conclusions
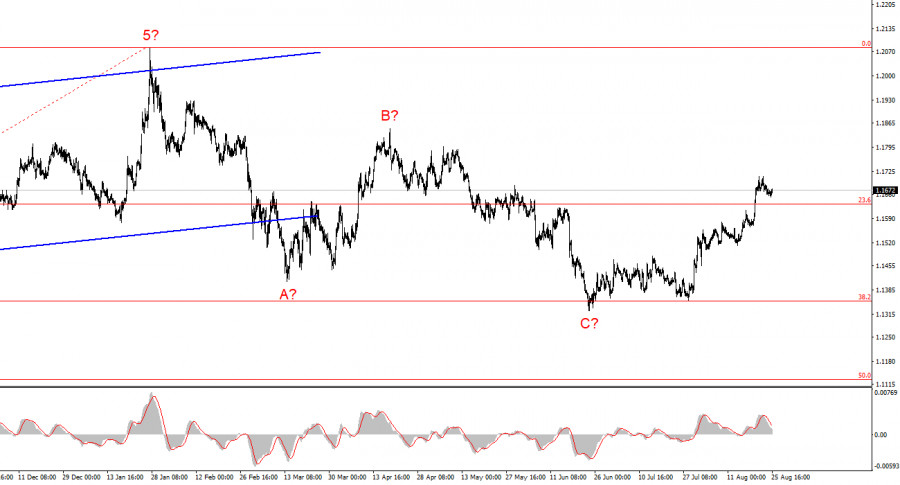
Based on my EUR/USD analysis, I conclude that the pair remains within the upward trend segment (lower chart) and, over the shorter term, has moved into a new upward wave sequence. In my view, this is an excellent time to build long positions. Unless the downward trend segment that began on January 28 develops into a more extended five-wave structure—which would require a strong fundamental backdrop in favor of the dollar—EUR/USD is at the very beginning of a new, prolonged upward trend segment, with targets extending as high as the 25th level.
On the higher timeframe, an upward trend segment can be seen, followed by the formation of a corrective wave sequence. The A-B-C structure is presumably complete. If this is the case, a new impulsive upward trend segment has begun to form.
Key Principles of My Analysis:
- Wave structures should be simple and clear. Complex structures are difficult to trade and often change.
- If there is no confidence about what is happening in the market, it is better not to enter.
- There can never be 100% certainty about the direction of a move. Do not forget to use protective Stop Loss orders.
- Wave analysis can be combined with other types of analysis and trading strategies.
EUR/USD – Smart Money Analysis: Bulls Await New Signals for Further Growth
25.08.2026
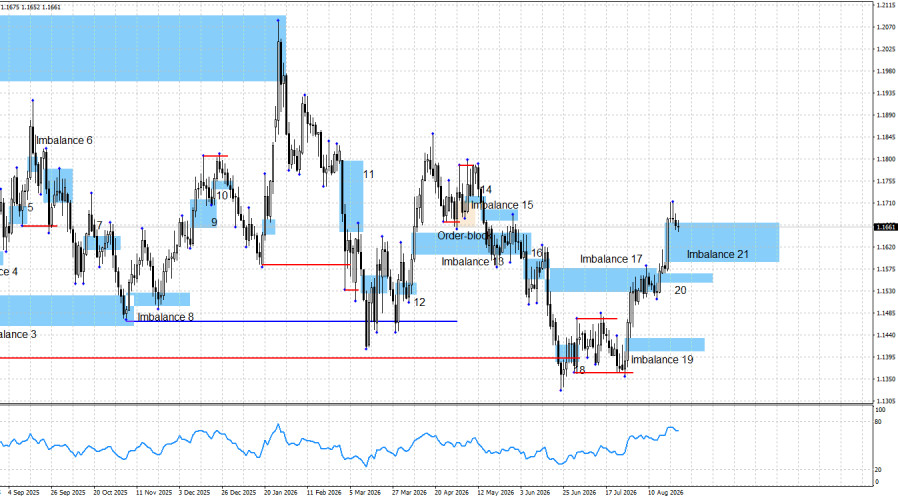
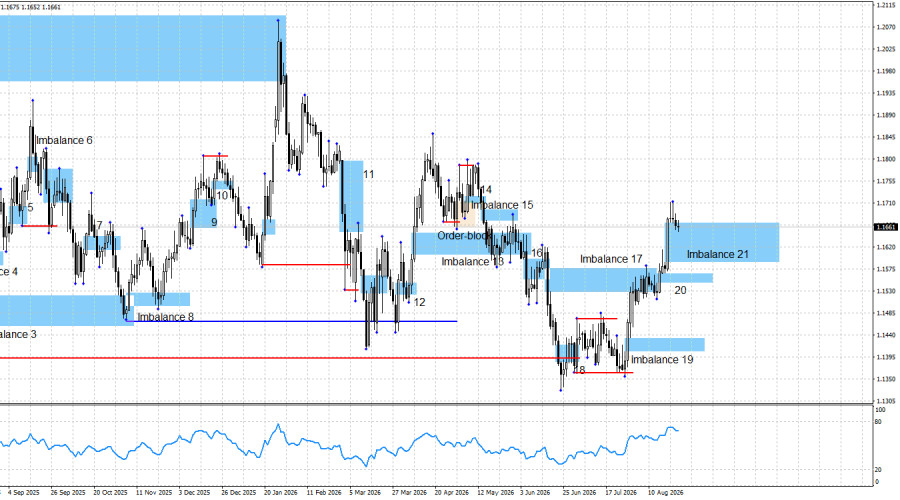
EUR/USD continues to rise, following the two liquidity sweeps marked by red lines on the chart. Imbalance 17 contained the bulls' advance for a long time and was eventually fully invalidated. Two new imbalances, 20 and 21, were also formed last week. Both are bullish. The nearest imbalance could lead to the formation of a signal at any point this week. Imbalance 21 is approximately 80 points wide, which is quite substantial given traders' activity in recent weeks. Therefore, the price could enter Imbalance 21 and remain there for a considerable amount of time. It could even decline to 1.1589 before beginning a new rise and forming a bullish signal. In any case, market sentiment remains bullish, which means that traders should be looking for buy signals.
In my view, the fundamental backdrop continues to fully support the bulls. First, any chart clearly shows that the euro began its rise from relatively low levels compared with the average price over the past year. Second, the market is no longer expecting FOMC monetary policy tightening in September. Third, the market has begun to question whether the Fed under Kevin Warsh can tighten monetary policy at all. Fourth, U.S. economic data has recently been disappointing. Fifth, geopolitics is no longer supporting the bears or the dollar. Sixth, the ECB may tighten monetary policy once again this autumn. Seventh, the U.S. Treasury Department has decided to increase its purchases of long-term bonds, reducing demand for the dollar. Eighth, a new trade war between the United States and Canada, as well as between the United States and China, could begin in the near future. Therefore, I see no reason for a bearish advance.
As I warned in recent weeks, if the labor market once again shows a weak result, this would be a sufficiently strong reason for the Fed to refrain from raising rates. At present, the state of the U.S. labor market is one of the key reasons for the dollar's decline, as it severely constrains the Fed's ability to tighten monetary policy. The annual Nonfarm Payrolls report will be released on Friday. If it comes in below forecasts, this will provide another reason for the U.S. currency to decline.
I would like to remind you that expectations regarding Fed monetary policy are always just expectations and can change in response to geopolitical developments or economic data. The market may anticipate monetary easing or tightening and price these expectations in, as we saw between June 17 and June 24. However, this does not mean that those expectations will materialize. The latest U.S. labor market data showed weak figures, inflation slowed, and GDP growth decelerated. These three factors have raised doubts about FOMC rate hikes not only in September but also in the foreseeable future. In my view, the bears' only opportunity now lies in a new escalation in the Middle East. However, Donald Trump is not seeking military escalation. He now wants to pressure Iran through economic measures.
The current chart structure points to a continuation of the bullish momentum as the more likely scenario. The bearish Imbalance 17 was tested, but the reaction to it was weak, and the pattern is now invalidated. The bullish Imbalance 19 remains untested. The new bullish Imbalance 20 also failed to provide traders with a buy signal. Another bullish Imbalance 21 has formed and could generate a signal this week. At present, the bulls have a much stronger position and better prospects than the bears.
The economic backdrop on Tuesday was relatively weak and had no impact on trader sentiment. In the morning, Germany released its second-quarter GDP and business climate reports. In the afternoon, the ADP report and new home sales data were released. None of these publications resulted in significant market movements.
There are still numerous reasons for the bulls to advance in 2026, and even the outbreak of war in the Middle East has not reduced their number. Structurally and globally, Trump's policies, which led to a significant decline in the dollar last year, have not changed. At present, I see no significant factors supporting the U.S. currency, despite the FOMC's formally hawkish stance. Geopolitical developments, which supported demand for the U.S. currency during much of the first half of 2026, can no longer provide such support. The conflict in the Middle East remains unresolved, but there have been no new military actions by either Iran or the United States.
News Calendar for the United States and the European Union:
- United States — Core Personal Consumption Expenditures (PCE) Price Index (12:30 UTC).
- United States — Change in Durable Goods Orders (12:30 UTC).
- United States — Change in Second-Quarter GDP (12:30 UTC).
- United States — Change in Personal Income and Spending (12:30 UTC).
On August 26, the economic calendar contains four releases, all scheduled for the same time. The economic backdrop may influence market sentiment during the second half of the day on Wednesday.
EUR/USD Forecast and Trading Recommendations:
In my view, the pair remains in the process of forming a bullish trend. The fundamental backdrop shifted sharply in favor of the bears six months ago, but the trend itself cannot be considered canceled or complete. Therefore, the bulls may well continue their advance following two liquidity sweeps of clearly defined lows. At present, bullish traders have support in the form of Imbalance 21. A new buy signal may form this week. I see 1.1797 and 1.1850 as the targets for further gains in the euro.
The material has been provided by InstaForex Company - www.instaforex.comEUR/USD: Trading Tips for Beginner Traders – August 25 (U.S. Session)
25.08.2026
Review of Trades and Trading Tips for the Euro
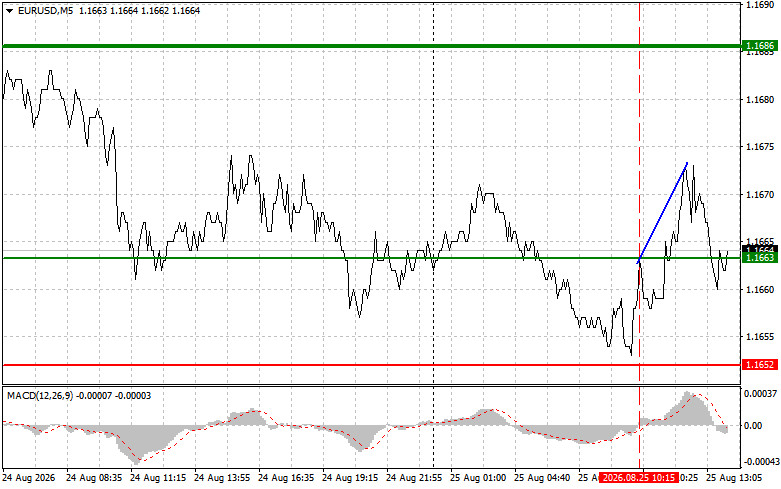
The test of 1.1663 occurred when the MACD indicator was just beginning to move upward from the zero line, confirming that this was the correct entry point for buying the euro. As a result, the pair rose by 10 points.
The single currency strengthened following two German reports, both of which pointed to an improvement in economic conditions. The Ifo Business Climate Index rose to 88.8 from 86.7 a month earlier, reaching its highest level in almost a year, while both the assessment of the current situation and expectations improved. Since the Ifo Index reflects business sentiment and is one of the first indicators to capture changes in the economic cycle, its rise became an important signal of a recovery. Sentiment was also supported by an upward revision to second-quarter GDP, to 0.3% quarter-on-quarter and 1.0% year-on-year.
In the second half of the day, the euro will await U.S. economic data that could put renewed pressure on the single currency. The Consumer Confidence Index, new home sales, and the Richmond Fed Manufacturing Index will be released. Consumer confidence is important because it allows the market to assess consumers' willingness to spend and, consequently, the prospects for economic growth, while new home sales and manufacturing data will provide additional information on demand and business activity. The outlook for the single currency is cautious. Strong data could lead to a more substantial rise in the dollar against risk-sensitive assets, putting pressure on EUR/USD.
As for the intraday strategy, I will rely primarily on the implementation of Scenarios #1 and #2.
Buy Signal
Scenario #1: Today, the euro can be bought when the price reaches around 1.1670 (the green line on the chart), with a target of 1.1686. At 1.1686, I plan to exit the market and also sell the euro in the opposite direction, targeting a move of 30–35 points from the entry point. A rise in the euro can be expected today only if U.S. economic data is weak. Important: Before buying, make sure that the MACD indicator is above the zero line and is just beginning to rise from it.
Scenario #2: Today, I also plan to buy the euro if the price tests 1.1659 twice consecutively while the MACD indicator is in the oversold zone. This would limit the pair's downward potential and lead to a reversal higher. A rise toward the opposite levels of 1.1670 and 1.1686 can be expected.
Sell Signal
Scenario #1: I plan to sell the euro after the price reaches 1.1659 (the red line on the chart). The target will be 1.1634, where I plan to exit the market and immediately buy in the opposite direction, targeting a 20–25-point move in the opposite direction from the level. Renewed pressure on the pair can be expected if the U.S. data is strong. Important: Before selling, make sure that the MACD indicator is below the zero line and is just beginning to decline from it.
Scenario #2: Today, I also plan to sell the euro if the price tests 1.1670 twice consecutively while the MACD indicator is in the overbought zone. This would limit the pair's upward potential and lead to a reversal lower. A decline toward the opposite levels of 1.1659 and 1.1634 can be expected.
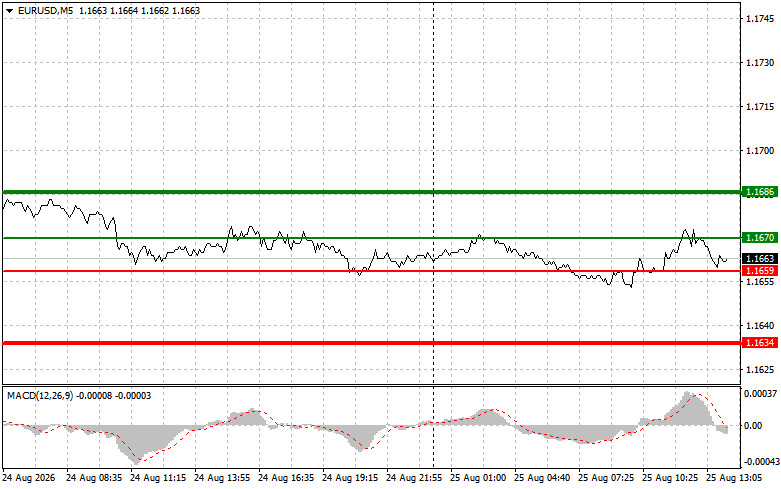
What the Chart Shows:
- Thin green line — the entry price at which the trading instrument can be bought;
- Thick green line — the estimated price at which Take Profit orders can be placed or profits can be taken manually, as further gains above this level are unlikely;
- Thin red line — the entry price at which the trading instrument can be sold;
- Thick red line — the estimated price at which Take Profit orders can be placed or profits can be taken manually, as further declines below this level are unlikely;
- MACD indicator. When entering the market, it is important to take the overbought and oversold zones into account.
Important. Beginner Forex traders should exercise extreme caution when making market-entry decisions. Before the release of important fundamental reports, it is best to stay out of the market to avoid being caught in sharp price fluctuations. If you decide to trade during a news release, always place stop orders to minimize losses. Without stop orders, you can lose your entire deposit very quickly, especially if you do not use proper money management and trade large volumes.
And remember that successful trading requires a clear trading plan, such as the one presented above. Making trading decisions spontaneously based on the current market situation is fundamentally a losing strategy for an intraday trader.
The material has been provided by InstaForex Company - www.instaforex.comEUR/USD – August 25: Bears Remain in Control at the Start of the Week
25.08.2026
On Monday, EUR/USD continued its decline after rebounding from the 127.2% retracement level at 1.1700, moving toward the 100.0% retracement level at 1.1620. A rebound from 1.1620 would favor the euro and a resumption of the advance toward 1.1700. Consolidation below 1.1620 would allow traders to expect a further decline toward the next Fibonacci level of 76.4% at 1.1551.
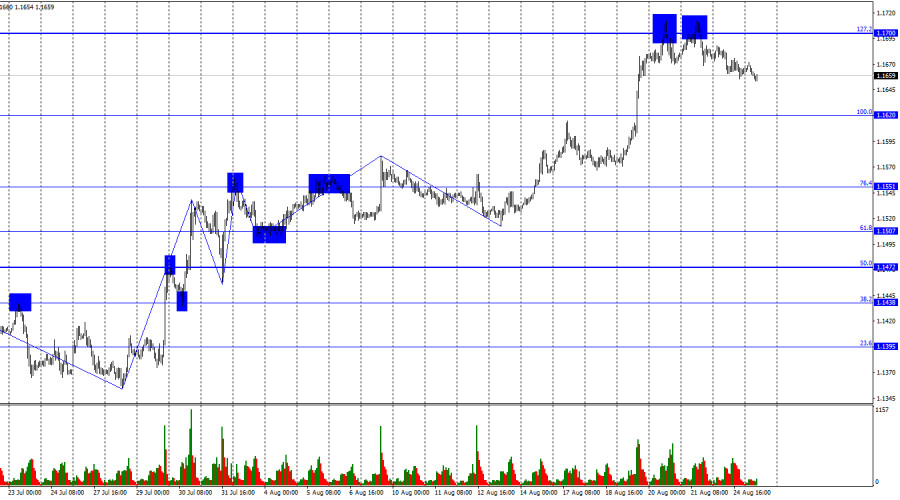
The wave situation on the hourly chart remains "bullish." The latest completed downward wave did not break the previous low, while the latest upward wave broke the previous high. Geopolitical developments remain consistently negative: negotiations between Iran and the United States are not taking place, and the blockade of the Strait of Hormuz remains in place. However, the FOMC's stance, which remains highly contradictory, is currently more important for the dollar.
There was no fundamental news backdrop on Monday. There were no reports or events during the day. However, this did not particularly upset traders. The bulls paused their attacks, while the bears took advantage of the pause and gradually pushed the exchange rate lower. The bears have little in the way of prospects at the moment. They may emerge tomorrow if U.S. economic data comes in stronger than it has over the past couple of months. In particular, traders will focus on the GDP report and the PCE price index. The former will show how much the U.S. economy slowed in the second quarter according to the second estimate, while the latter will show how much prices for core personal consumption expenditures increased in July. Personally, I do not consider the PCE index important, and it also tends to lag behind headline and core inflation. The market has already seen the July inflation data, so the PCE index is unlikely to change traders' overall conclusions. Inflation in the United States is slowing, but it is doing so within the range of an acceptable pullback caused by the pause in the conflict between the United States and Iran in June and July. The conflict resumed in August, oil prices increased, so an increase in headline inflation for this month should also be expected.
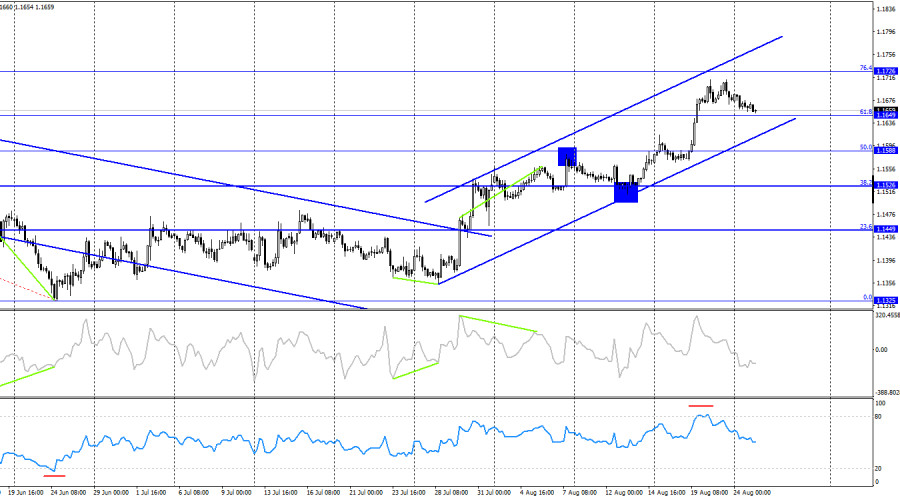
On the 4-hour chart, the pair consolidated above the 61.8% retracement level at 1.1649. Thus, the euro's advance may continue toward the next Fibonacci level of 76.4% at 1.1726. The upward trend channel indicates a full-fledged "bullish" advance. The U.S. dollar can be expected to strengthen only after the price closes below the channel. No emerging divergences are observed today, but the RSI indicator has entered overbought territory (above 80), which suggests that a corrective pullback may occur.
Commitments of Traders (COT) Report:
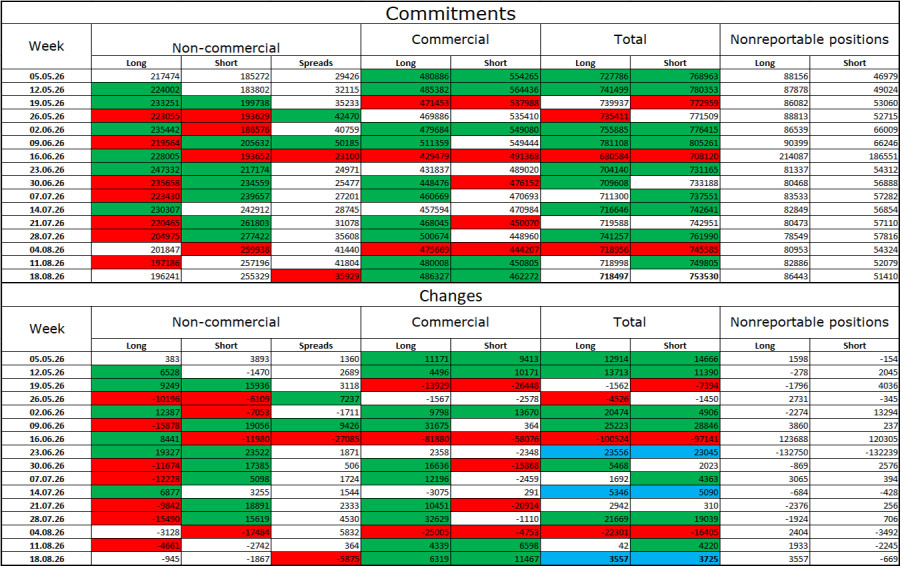
During the latest reporting week, professional traders closed 945 Long positions and 1,876 Short positions. Over seven weeks in February and March, the bulls' overwhelming advantage disappeared because of the war in Iran, while over the past twenty-one weeks the situation has become more balanced amid the supposed ceasefire and market hopes for an end to the war. The total number of Long positions held by speculators currently stands at 196,000, while the number of Short positions stands at 255,000. The bears are once again taking the lead.
Overall, over the long term, major market participants continue to show considerably greater interest in the euro. Undoubtedly, events of various kinds around the world, of which there has been no shortage in recent years, affect investor sentiment. In particular, the market is currently keeping a close eye on the situation in the Middle East, where the war seems to end and then resume again. The market initially ignored the ceasefire and then ignored the resumption of the war. Thus, geopolitics no longer determines the dollar's fate on its own.
News Calendar for the United States and the European Union:
- Germany – Final second-quarter GDP reading (06:00 UTC).
- Germany – Ifo Business Climate Index (08:00 UTC).
- U.S. – Weekly ADP employment report (12:15 UTC).
- U.S. – CP Consumer Confidence Index (14:00 UTC).
- U.S. – New Home Sales (14:00 UTC).
On August 25, the economic calendar contains five entries, none of which I would consider important. The impact of the economic backdrop on market sentiment on Tuesday will be extremely weak or nonexistent.
EUR/USD Forecast and Trading Tips:
Buying the pair is possible if it consolidates above 1.1700 on the hourly chart or rebounds from 1.1620. Sell trades were possible following a rebound from 1.1700 on the hourly chart, with a target of 1.1620. These trades can remain open today.
The Fibonacci level grids are drawn from 1.1620–1.1325 on the hourly chart and from 1.1849–1.1325 on the 4-hour chart.
The material has been provided by InstaForex Company - www.instaforex.comForex forecast 25/08/2026: EUR/USD, USD/JPY, GBP/USD, SP500, OIL, BTC
26.08.2026
We introduce you to the daily updated section of Forex analytics where you will find reviews from forex experts, up-to-date monitoring of financial information as well as online forecasts of exchange rates of the US dollar, euro, ruble, bitcoin, and other currencies for today, tomorrow and this trading week.
Useful links:
My other articles are available in this section
InstaForex course for beginners
Important:
The begginers in forex trading need to be very careful when making decisions about entering the market. Before the release of important reports, it is best to stay out of the market to avoid being caught in sharp market fluctuations due to increased volatility. If you decide to trade during the news release, then always place stop orders to minimize losses.
Without placing stop orders, you can very quickly lose your entire deposit, especially if you do not use money management and trade large volumes. For successful trading, you need to have a clear trading plan and stay focues and disciplined. Spontaneous trading decision based on the current market situation is an inherently losing strategy for a scalper or daytrader.
#instaforex #analysis #sebastianseliga
The material has been provided by InstaForex Company - www.instaforex.comTrading Recommendations for Bitcoin on August 26 According to the ICT System
26.08.2026
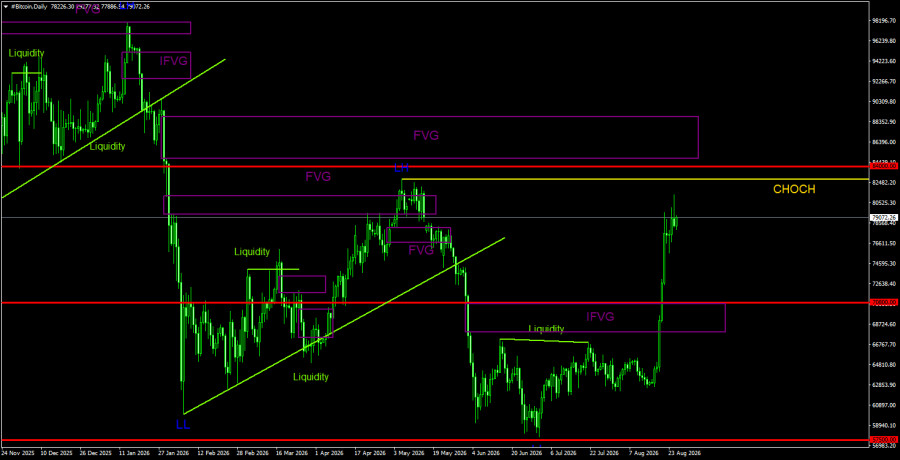
Bitcoin has surged by $17,000 and continues to rise. The price has easily surpassed the only bearish pattern on the daily timeframe and is now confidently moving toward the trend break line. A sell signal has not formed, so the bearish FVG pattern now becomes a bullish IFVG. However, it is noteworthy that neither Ethereum nor Bitcoin has broken their downward trends that began last year. Therefore, regardless of how sharp and strong the current rise is, one should count the chickens in the autumn. In any case, no trading signals have been formed in recent days, and all movements appear to be just another pump.
In the meantime, well-known crypto critic Peter Schiff has reported that artificial intelligence is already creating problems for Bitcoin and may slow the development of the first cryptocurrency. Schiff believes that AI will continue to draw a significant share of investor capital away, negatively impacting the prospects for "digital gold." He also noted that most Bitcoin supporters try to present the AI sector as a favorable factor, but in reality, it is not. Artificial intelligence represents a threat to Bitcoin. According to Schiff, Bitcoin and AI will compete for capital as well as for electricity and computational power. He also mentioned that potentially more advanced AI agents could find vulnerabilities in Bitcoin's code that are not visible to the average person.
From our perspective, the AI sector is already posing serious competition to Bitcoin. There is not only capital flowing into the stocks of companies associated with the development of artificial intelligence, but miners are also transitioning into the AI sector. Thus, we do not expect a new bullish trend for Bitcoin in the near future, and the recent upswing can be classified as a classic pump. By the way, the downward trend has not been broken, and there is a high probability of forming a sideways trend on the daily and weekly timeframes.
Overall Picture of BTC/USD on 1D
On the daily timeframe, Bitcoin continues to form a downward trend. The trend structure is identified as downward, and the CHOCH line is located at $82,800, where the last LH (Lower High) was formed. Only above this level can it be said that the downward trend has ended. The last and only bearish FVG was completely pierced through and transformed into a bullish IFVG. Thus, this area now serves as a POI for long positions. Bitcoin has not yet broken the downward trend, but in recent weeks, the chances of the bearish trend concluding have sharply increased. This cannot be denied.
Overall Picture of BTC/USD on 4H
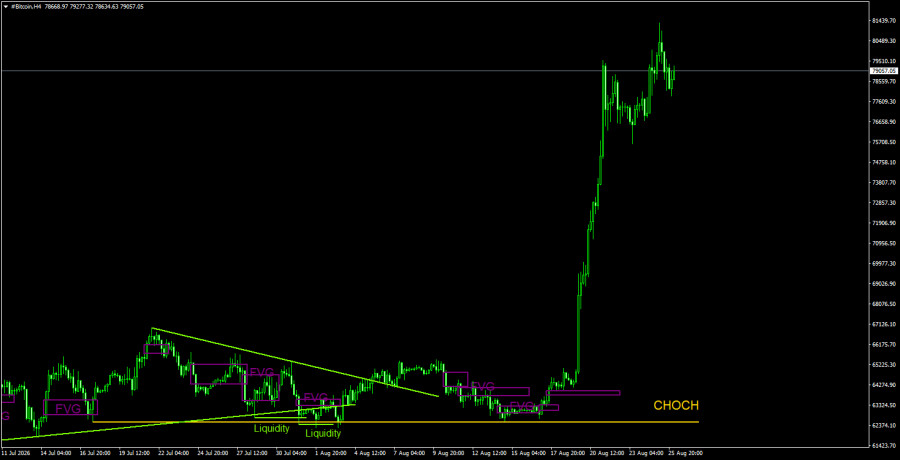
On the 4-hour timeframe, it is clear how Bitcoin has literally skyrocketed. Analyzing the 4-hour timeframe at this time has little meaning, as the movements are too strong. Therefore, signals should be sought on the daily or even weekly timeframes.
Trading Recommendations for BTC/USD:
Bitcoin continues to form a downward trend, despite the strong growth this week. We continue to expect a decline toward $57,500 (the 61.8% Fibonacci level of the three-year upward trend), although this level has already been tested. However, we do not consider this downward trend to be over. The last bearish FVG pattern has been invalidated, and there are essentially no POI areas for short positions on higher timeframes. However, on the weekly timeframe, the current rise can be classified as a correction. We understand that the current rise in the leading cryptocurrency bears little resemblance to a correction, but this does not make a compelling argument for opening long positions. The current movement resembles pricing without the formation of patterns and signals. Each trader must decide for themselves whether they want to open positions "in thin air."
Notes on Illustrations:
- CHOCH – Change of trend structure.
- Liquidity – Stop-loss and pending orders that market makers use to build their positions.
- FVG – Fair Value Gap. Price moves very quickly through such areas, indicating a complete absence of one side in the market. Subsequently, the price tends to return and react to these areas in continuation of the main trend.
- IFVG – Inverted Fair Value Gap. After returning to such an area, the price does not react; instead, it pushes through it and then tests it from the opposite side.
- OB – Order Block. The candle on which the market maker opened a position to accumulate liquidity to form their position in the opposite direction.
Trading Signals for EUR/USD on August 25-27, 2026: sell below $4,670 (21 SMA - 6/8 Murray)
26.08.2026
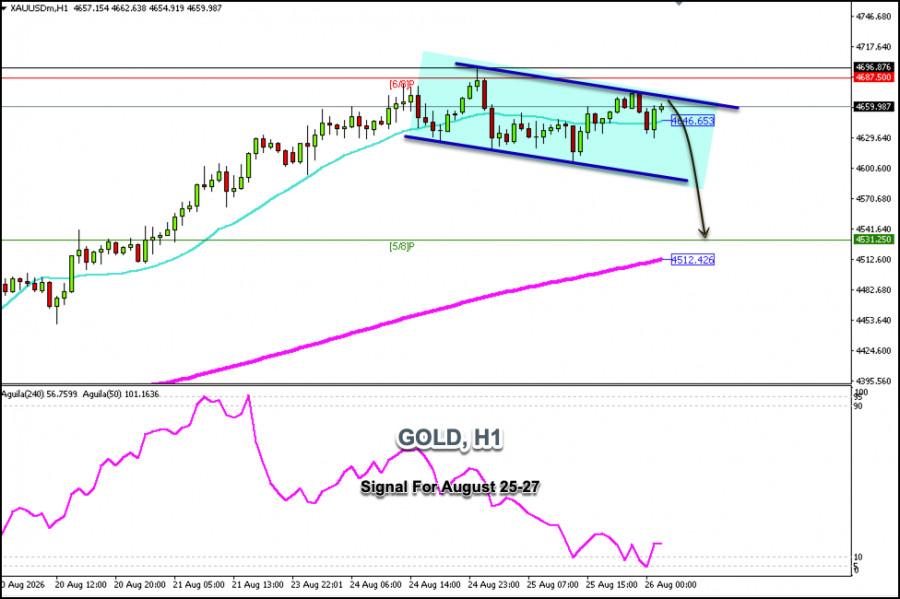
Gold is trading around $4,659 under downward pressure after reaching a high of $4,696. On the chart, we can see that a technical bounce has occurred toward the 61.8% Fibonacci level. If the price remains below the 8/8 Murray line, we could see it preparing for a continuation of the downward trend.
In the coming hours, we could sell gold below $4,670, as we observe a small downtrend channel forming from its high of $4,696. The instrument could likely reach $4,630 and $4,600 over the next few hours. Ultimately, gold could fall to the 5/8 Murray level around $4,531.
Gold has strong support around $4,512; this level, in turn, lies above the psychological threshold of $4,500, so it could provide solid support and might be seen as an opportunity to open long positions only if a technical rebound occurs in this zone.
If gold continues to rise in the coming hours and reaches the 6/8 Murray level around $4,687. If it fails to break above this zone, we could view this as an opportunity to open short positions in anticipation of a drop to $4,500 in the coming days.
Our trading plan for the coming hours is to sell gold below $4,687 or $4,670, with targets at $4,620, $4,570, and $4,531; the Eagle indicator is showing a negative signal.
The material has been provided by InstaForex Company - www.instaforex.comTrading Signals for EUR/USD on August 25-27, 2026: sell below 1.1675 (21 SMA - 7/8 Murray)
26.08.2026
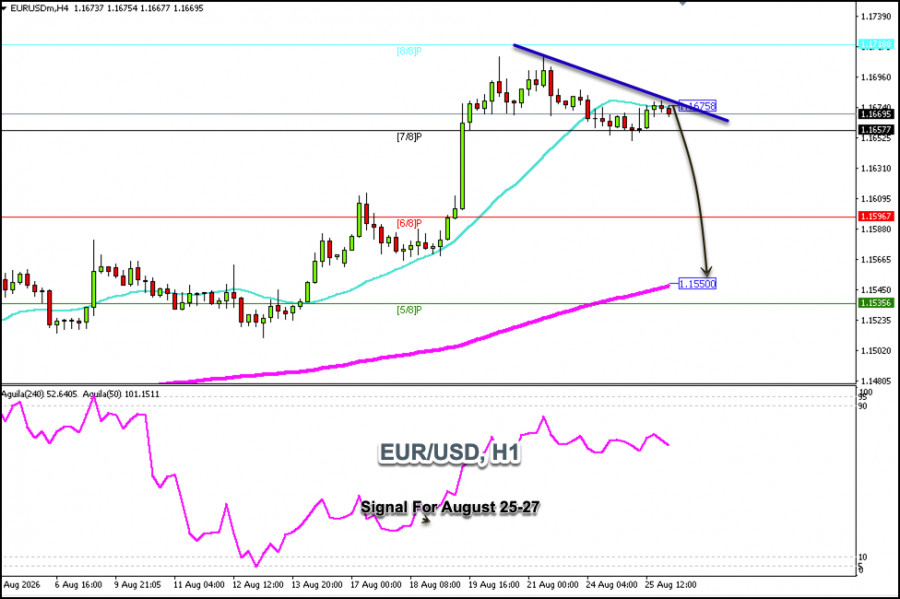
The euro is trading around 1.1675, below the 21-day simple moving average (SMA), and we expect it to continue rising in the coming hours if the price consolidates above 1.1675.
If the euro consolidates below 1.1680 in the coming hours, the outlook could turn negative, and EUR/USD is expected to reach the Murray 7/8 level, around 1.1657.
A decisive break below the Murray 7/8 level could trigger a strong downward move, which could push EUR/USD down to the Murray 6/8 level at 1.1596.
On the H1 chart, the Eagle indicator is giving a negative signal, so we will look for opportunities to sell below 1.1675, with targets at 1.1657, 1.1600, 1.1596, and finally, we expect EUR/USD to reach the 200-period exponential moving average (EMA) around 1.1550.
The material has been provided by InstaForex Company - www.instaforex.comTrading Signals for BTC/USD on August 25-27, 2026: sell below $80,000 (21 SMA - 5/8 Murray)
26.08.2026
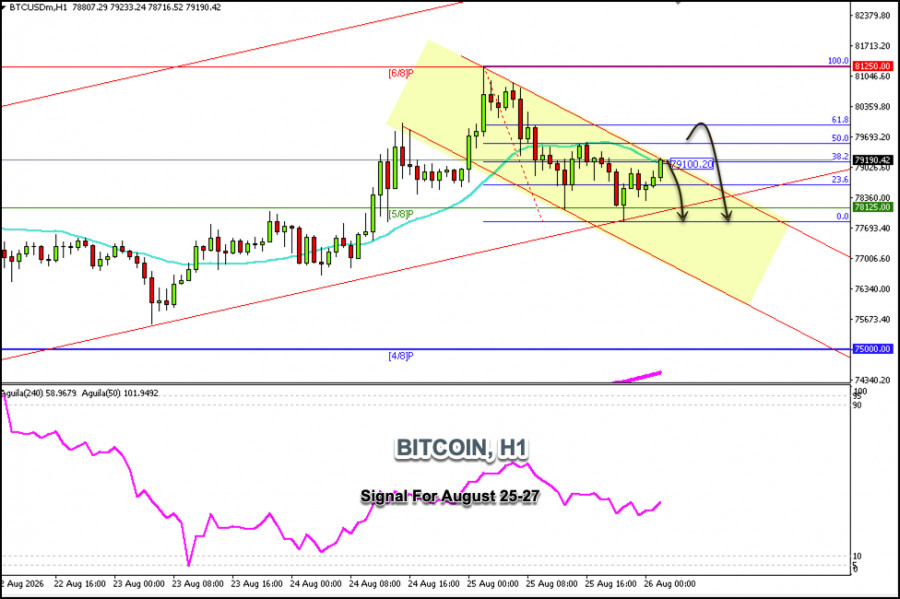
Bitcoin is trading around $79,120 within a downtrend channel formed on the H1 chart since its high of $81,250. Bitcoin could continue its rise in the coming hours until it reaches the 61.8% Fibonacci level around $80,000.
If Bitcoin falls below the 21 SMA—located around the 38.2% Fibonacci level—in the coming hours, we could expect it to resume its downtrend and potentially reach the 5/8 Murray level around $78,125; it could even approach the August 24 low around $76,000.
Conversely, a decisive break above the 21 SMA and above $79,100 will be seen as a buy signal with targets at the psychological level of $80,000; ultimately, we expect it to reach the 6/8 Murray level around $81,250.
The Fibonacci indicator suggests a potential technical rebound to the psychological level of $80,000. Technically, we could wait for this zone to open short positions or expect BTC to encounter strong resistance and, in turn, form a double-top pattern around $81,225—which could also be seen as a clear signal to sell.
A decisive break below the 5/8 Murray level could signal a strong bearish trend, and we expect it to reach the 4/8 Murray level around $75,000 in the short term.
The material has been provided by InstaForex Company - www.instaforex.comWhat to Pay Attention to on August 26? Analysis of Fundamental Events for Beginners
26.08.2026
Analysis of Macroeconomic Reports:
Several macroeconomic publications are scheduled for Wednesday. In Germany, the Eurozone, and the UK, the event calendar is empty. Still, in the U.S., relatively important reports on GDP, durable goods orders, and the core Personal Consumption Expenditures (PCE) price index will be released. We cannot say these are super important reports; however, some market reaction may follow. In our view, the key report will be the GDP data. The first estimate showed a slowdown in growth to 1.5% in the second quarter, and the second estimate may differ from the first. It is currently very difficult to expect positive trends from the American economy, so the dollar may resume its decline today.
Analysis of Fundamental Events:
Among the fundamental events on Wednesday, the only notable one is the speech by Federal Reserve representative Thomas Barkin. Yesterday, Barkin did not provide any substantial information for traders. We do not expect a hike in the Fed's key interest rate in September, as all recent macroeconomic reports argue against tightening monetary policy. The European Central Bank, on the other hand, may conduct its second monetary tightening this fall, as will the Bank of England.
The geopolitical backdrop still leaves much to be desired. The U.S. and Iran are not currently engaged in any negotiations, the Strait of Hormuz remains closed or partially closed, and the Yemeni Houthis maintain a blockade of Saudi Arabia. Tehran has outlined a list of demands to Washington necessary for reopening the Strait of Hormuz, which Donald Trump will not agree to under any circumstances. Iran has also warned Washington that if the blockade is not lifted, it will conduct a "cleansing" of the strait with its own forces. Trump has initiated an unprecedented economic operation to devastate Iran and threatens to impose sanctions on all countries that interact with it in any way. Iran has responded with threats to close other straits and routes if other countries join the pressure on Washington.
General Conclusions:
During the third trading day of the week, currency pairs may trade a bit more actively, but mainly in the second half of the day. The euro can be traded today from the area of 1.1655-1.1665, while the British pound can be traded from the area of 1.3631-1.3641. Overall, we expect both the euro and the pound to strengthen further against the U.S. dollar, and only geopolitics or a technical need for correction could impede the upward momentum.
Main Rules of the Trading System:
- The strength of the signal is assessed by the time it took to form the signal (bounce or level breakthrough). The less time required, the stronger the signal.
- If two or more trades are opened around a certain level based on false signals, all subsequent signals from that level should be ignored.
- In a flat, any pair can form a multitude of false signals or none at all. Technical levels may be disregarded.
- When trading based on MACD signals on the hourly timeframe, it is advisable to do so only when volatility is high and a trend line or channel supports the trend.
- If two levels are too close to each other (from 5 to 20 pips), they should be regarded as a support or resistance area.
- After a 15-pip move in the correct direction, a Stop Loss should be set to break even.
What the Charts Show:
Support and resistance price levels (areas) are the targets when opening buy or sell orders or sources of signals.
Red lines denote channels or trend lines that reflect the current trend and indicate in which direction trading is currently favored.
The MACD indicator (14,22,3) – histogram and signal line – is a supporting indicator that can also be used as a source of signals.
Important speeches and reports (as listed in the news calendar) can significantly influence the movement of the currency pair. Therefore, during their release, trading should be approached with utmost caution, or one should exit the market to avoid sharp price reversals against the preceding movement.
Beginners in Forex trading should remember that not every trade can be profitable. Developing a clear strategy and proper money management are essential for long-term trading success.
The material has been provided by InstaForex Company - www.instaforex.comHow to Trade the GBP/USD Currency Pair on August 26? Simple Tips and Trade Analysis for Beginners
26.08.2026
Analysis of Tuesday's Trades:
1H Chart of the GBP/USD Pair
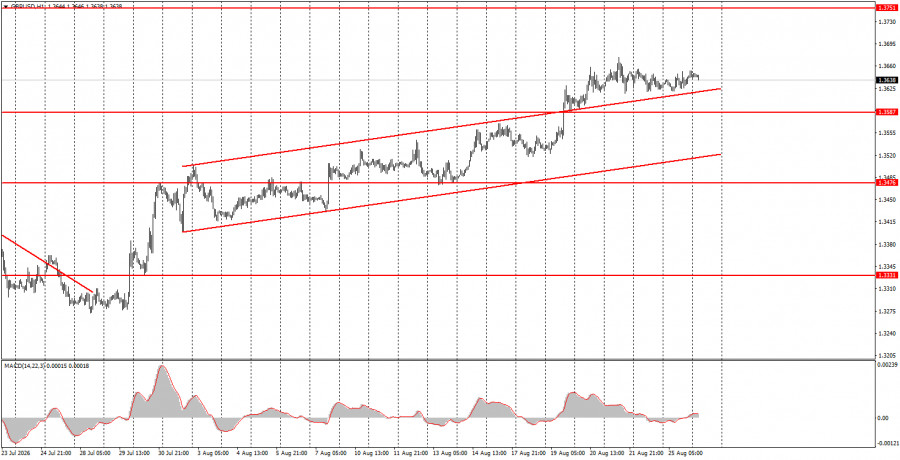
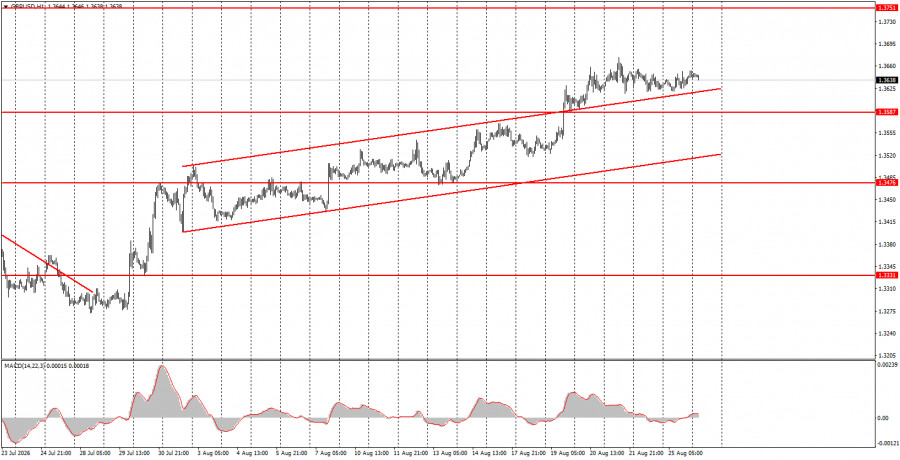
The GBP/USD pair showed no interesting movements on Tuesday, with volatility even lower than in previous days. There were no significant events throughout the day in either the U.S. or the UK. News emerged that Donald Trump might lift the economic blockade on Iran if Iran removes the blockade of the Strait of Hormuz. However, the validity of this information remains unknown. At least the currency market did not react to it, while oil prices slightly declined. Thus, there is a small chance the market will awaken today, as reports on GDP and durable goods orders will be released in the U.S., along with the core Personal Consumption Expenditures (PCE) price index. However, the main movements are expected on Friday when Kevin Warsh speaks and the annual NonFarm Payrolls report is published.
5M Chart of the GBP/USD Pair
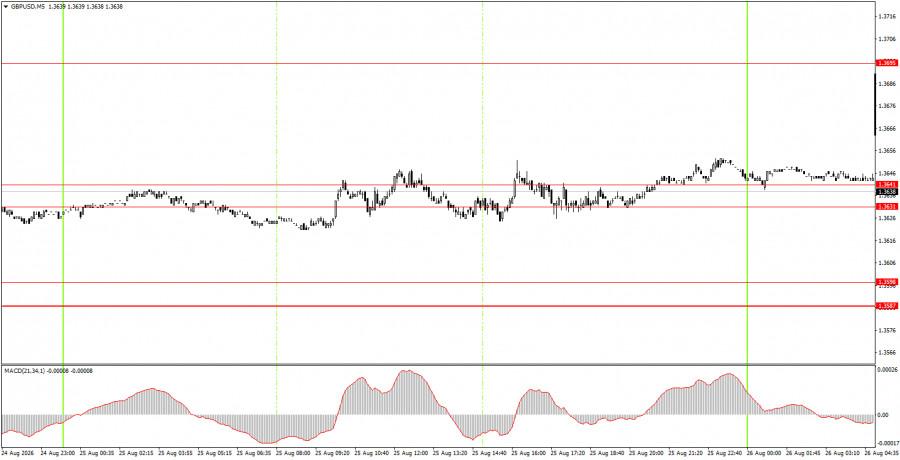
On the 5-minute timeframe, one or two trading signals were formally formed on Tuesday. Still, throughout the day, the movements were so scattered and disconnected from the technical levels that we wouldn't have entered the market on such signals. The price once again ignored the 1.3631-1.3641 area, and there was virtually no movement in the market.
How to Trade on Wednesday:
On the hourly timeframe, the GBP/USD pair continues to maintain an upward trend. In our view, the British pound should continue to rise, even if local factors do not provide support. The weekly timeframe indicates continued movement from the lower boundary of the sideways channel to the upper boundary, and this movement is not yet complete. The market's faith in a Federal Reserve rate hike in September is visibly waning, as all recent macroeconomic data and events have exerted pressure on the dollar. Only a settlement below the upward channel on the hourly timeframe would allow for expectations of a decline in the pair.
On Wednesday, novice traders may consider opening short positions if the price settles below the 1.3631-1.3641 area, targeting 1.3587-1.3598. Long positions can be initiated on a bounce from the 1.3631-1.3641 area, targeting 1.3695.
On the 5-minute timeframe, traders can consider trading at levels 1.3259-1.3267, 1.3319-1.3331, 1.3380-1.3386, 1.3456-1.3476, 1.3587-1.3598, 1.3631-1.3641, 1.3695, and 1.3741. On Wednesday, there are no significant events or publications scheduled in the UK, while the U.S. will release reports on GDP, durable goods orders, and the core PCE price index.
Main Rules of the Trading System:
- The strength of the signal is assessed based on the time it took to form (bounce or level breakthrough). The less time required, the stronger the signal.
- If two or more trades are opened around a certain level based on false signals, all subsequent signals from that level should be ignored.
- In a flat, any pair can generate a plethora of false signals or none at all. Technical levels may be disregarded.
- When trading based on MACD signals on the hourly timeframe, it is advisable to do so only when volatility is high and a trend line or channel supports the trend.
- If two levels are too close to each other (from 5 to 20 pips), they should be regarded as a support or resistance area.
- After a 15-pip move in the correct direction, a Stop Loss should be set to break even.
What the Charts Show:
Support and resistance price levels (areas) are the targets when opening buy or sell orders or sources of signals.
Red lines denote channels or trend lines that reflect the current trend and indicate in which direction trading is currently favored.
The MACD indicator (14,22,3) – histogram and signal line – is a supporting indicator that can also be used as a source of signals.
Important speeches and reports (as listed in the news calendar) can significantly influence the movement of the currency pair. Therefore, during their release, trading should be approached with utmost caution, or one should exit the market to avoid sharp price reversals against the preceding movement.
Beginners in Forex trading should remember that not every trade can be profitable. Developing a clear strategy and proper money management are essential for long-term trading success.
The material has been provided by InstaForex Company - www.instaforex.comHow to Trade the EUR/USD Currency Pair on August 26? Simple Tips and Trade Analysis for Beginners
26.08.2026
Analysis of Tuesday's Trades:
1H Chart of the EUR/USD Pair
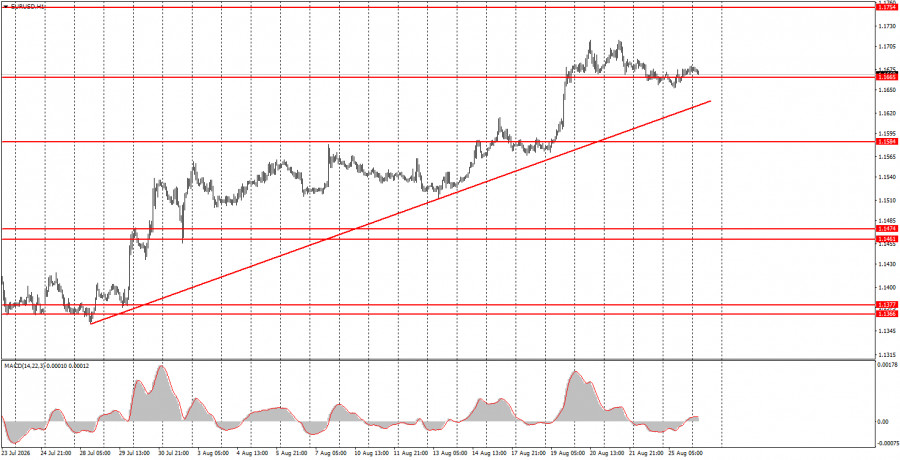
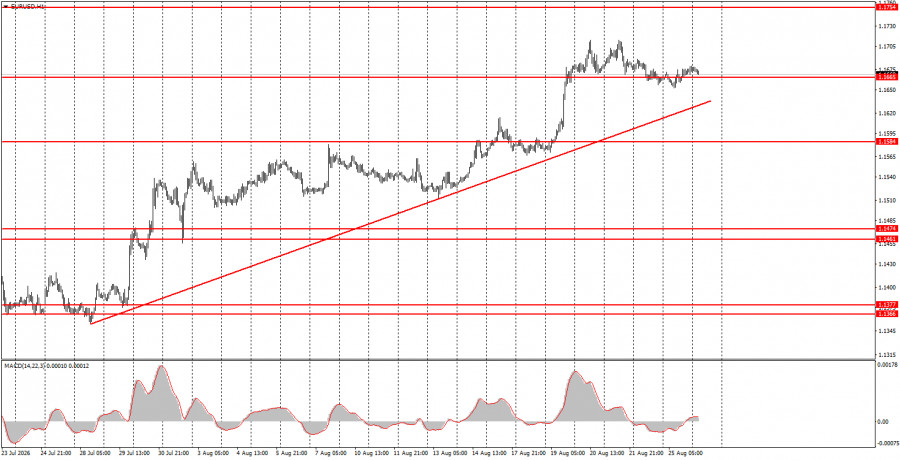
The EUR/USD currency pair showed no interesting movements during trading on Tuesday. Despite several macroeconomic publications throughout the day in Germany and the U.S., the overall volatility was less than 30 pips. The European currency remains above the trend line, so the trend remains intact. Only a price consolidation below the trend line would allow the dollar to improve its dismal position slightly.
Returning to yesterday's reports and events, we initially stated that the market should not be expected to react to clearly secondary reports. Today, the situation may change, as important reports on GDP, PCE, and durable goods orders will be released in the U.S. However, we believe the market may well ignore these publications as well. Low volatility has been recorded for three weeks now, indicating a general reluctance of the market to move. It seems we will have to wait until Friday for the market to awaken somewhat.
5M Chart of the EUR/USD Pair
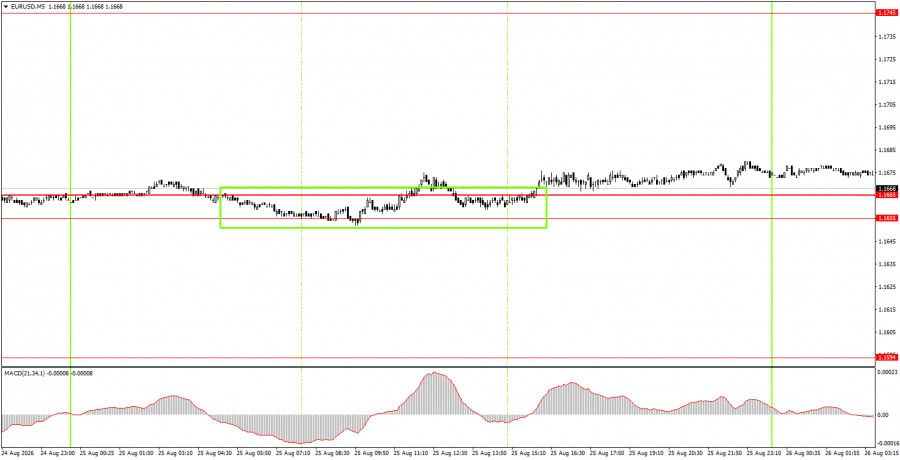
On the 5-minute timeframe, a single buy signal was formally formed on Tuesday. At around 10 AM, the price attempted to rebound from the 1.1655-1.1665 area, ultimately succeeding. However, whether the upward movement will continue remains unclear. Volatility remains very weak.
How to Trade on Wednesday:
On the hourly timeframe, the EUR/USD pair continues to form an upward trend. Considering all the events of recent months, we believe that the European currency should continue its steady growth even without local support. Currently, there are no factors for growth in the American currency, so we continue to expect upward movement.
On Wednesday, novice traders may consider short positions with targets of 1.1584-1.1594 if the price settles below the 1.1655-1.1665 area. Long positions can be initiated on a bounce from the 1.1655-1.1665 area, targeting 1.1745-1.1754.
On the 5-minute timeframe, traders should consider levels 1.1366-1.1377, 1.1461-1.1474, 1.1527-1.1531, 1.1584-1.1594, 1.1655-1.1665, 1.1745-1.1754, and 1.1830-1.1837. On Wednesday, there are no significant events or publications scheduled in Germany and the Eurozone, while the U.S. will release relatively important reports on PCE, GDP, and durable goods orders. We believe that a market reaction to this data may occur, but it is unlikely to be strong.
Main Rules of the Trading System:
- The strength of the signal is determined by the time it takes to form the signal (bounce or level breakthrough). The less time required, the stronger the signal.
- If two or more trades are opened around a level based on false signals, all subsequent signals from that level should be ignored.
- In a flat, any pair can generate a multitude of false signals or none at all. Technical levels may be disregarded.
- When trading based on MACD signals on the hourly timeframe, it is advisable to do so only when volatility is high and a trend line or channel supports the trend.
- If two levels are too close to each other (from 5 to 20 pips), they should be regarded as a support or resistance area.
- After a 15-pip move in the correct direction, a stop-loss should be set to break even.
What the Charts Show:
Support and resistance price levels (areas) are the targets when opening buy or sell orders or sources of signals.
Red lines denote channels or trend lines that reflect the current trend and indicate in which direction trading is currently favored.
The MACD indicator (14,22,3) – histogram and signal line – is a supporting indicator that can also be used as a source of signals.
Important speeches and reports (as listed in the news calendar) can significantly influence the movement of the currency pair. Therefore, during their release, trading should be approached with utmost caution, or one should exit the market to avoid sharp price reversals against the preceding movement.
Beginners in Forex trading should remember that not every trade can be profitable. Developing a clear strategy and proper money management are essential for long-term trading success.
The material has been provided by InstaForex Company - www.instaforex.comGBP/USD Review. August 25. What Will Kevin Warsh's Speech Change?
26.08.2026
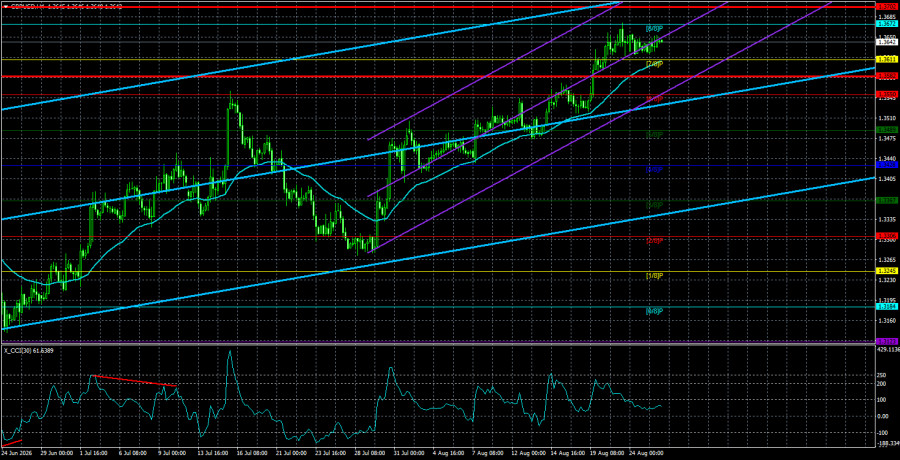
The GBP/USD currency pair remained largely immobilized on Monday, as traders had nothing to react to during the day. Given that the event calendar was empty for Monday, we anticipated little market movement. While there were some news items, none indicated a significant change in the value of the dollar or the British pound.
A key theme for the currency market remains Donald Trump's policy, which entails the creation of new conflicts worldwide. Just this past weekend, it was revealed that Canada and the U.S. failed to reach a trade deal, leading Washington to impose a 50% tariff on most Canadian imports. Canadian Prime Minister Mark Carney announced that Ottawa would implement reciprocal tariffs starting September 8, and the Trump administration has already begun crafting a new tariff package. If anyone has forgotten about the phenomenon known as a trade war, now is the time to refresh their memory of 2025, when the U.S. dollar fell sharply.
A new round of trade confrontation could also begin with China, with which a tenuous agreement was reached last year. Recall that in 2025, import tariffs between the two countries reached as high as 250%. This year, Trump seems to think the relationship between the U.S. and China has become too dull, hence the need to stir things up a bit. However, this time, Trump intends to combat not universal injustice against America, but rather long-suffering Iran. Trump has decided to impose a full financial blockade on Tehran, entirely cutting it off from financial flows. Since America cannot encircle Iran and generally wants to limit bloodshed in this conflict, Trump envisions that other nations should join in the confrontation against Iran. Last year, Trump did not receive support from European countries, and this year he aims to involve countries with which Tehran has allied relationships.
Primarily, this concern pertains to China, which is the main importer of Iranian oil. Trump believes that all countries doing business with Iran must immediately cease this "nonsense" and side with the U.S. We can almost 100% guarantee that Beijing does not share this view and will continue to adhere to its own political course. Since Trump has already publicly declared grand sanctions and tariffs against any country supporting Iran, it can be presumed that new tariffs and restrictions will be proposed against China. In response, Beijing will impose its own tariffs and restrictions on the U.S. Thus, the second half of 2026 may unfold under the guise of a second round of a global trade war. If anyone does not recall, the trade war was the main cause of the dollar's decline last year. Consequently, yet another factor contributing to the dollar's decline is added to an already long list.
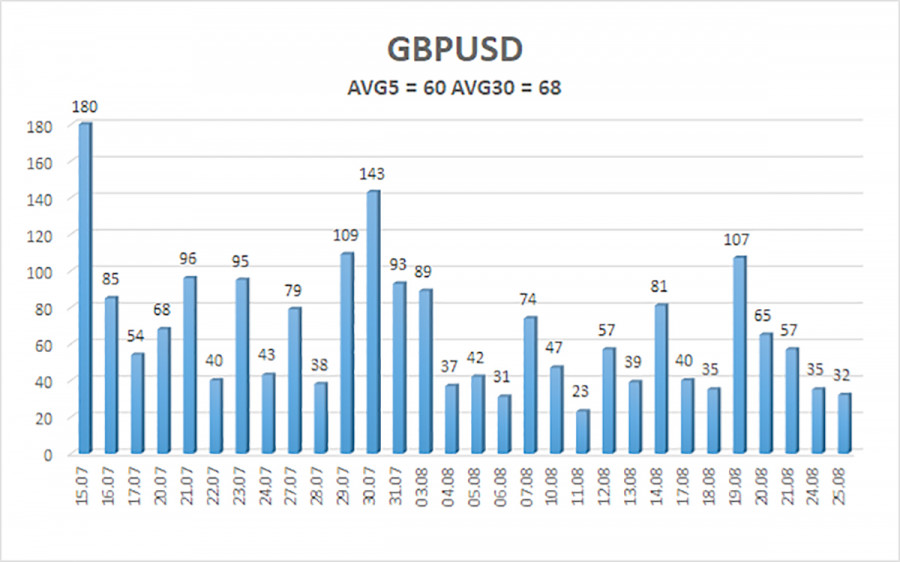
The average volatility of the GBP/USD pair over the past 5 trading days as of August 25 is 60 pips. For the pound/dollar, this value is considered "average." On Tuesday, August 25, we expect movement within a range limited by levels 1.3572 and 1.3692. The upper linear regression channel is directed upward, indicating an upward trend. The CCI indicator has once again entered the overbought zone, signaling a potential correction.
Nearest Support Levels:
S1 – 1.3611
S2 – 1.3550
S3 – 1.3489
Nearest Resistance Levels:
R1 – 1.3672
R2 – 1.3733
R3 – 1.3794
Trading Recommendations:
The GBP/USD currency pair maintains an upward trend. Donald Trump's policies will continue to exert pressure on the U.S. economy, so we do not expect long-term growth in the U.S. dollar. So far, 2026 has turned out to be super-positive for the dollar due to geopolitical factors, but every tale has its end.
The weekly timeframe shows a flat market between 1.3150 and 1.3780, within the framework of a four-year upward trend, which supports continued medium-term growth of the British currency. Long positions with targets at 1.3672 and 1.3702 can be considered when the price is above the moving average. If the price is below the moving average line, short trades can be made with targets at 1.3550 and 1.3489.
Notes on Illustrations:
- Linear Regression Channels help determine the current trend. If both are pointing in the same direction, it indicates that the trend is currently strong.
- Moving Average Line (settings: 20, 0, smoothed) determines the short-term trend and the direction in which to trade.
- Murray Levels – target levels for movements and corrections.
- Volatility Levels (Red Lines) – the likely price channel in which the pair will trade over the next 24 hours based on current volatility metrics.
- CCI Indicator – its entry into the oversold area (below -250) or the overbought area (above +250) indicates an impending trend reversal in the opposite direction.
A Cry for Help from Washington
26.08.2026

At the same time, experts report that Trump's latest initiatives are a cry not only of desperation but also for help. Many military experts believe that the U.S. lacks the resources for a prolonged siege of Iran. A siege is neither simple nor cheap, and the U.S. federal budget is already under strain. The national debt has surpassed $40 trillion. In November, the Republican Party is likely to lose the congressional elections, after which the Democrats will block any decisions and initiatives from Trump. And certainly, no one will allocate additional funds for warfare to Trump.
Therefore, Trump needs to hurry to conclude the conflict with Iran before the congressional elections, preferably with a victory. This is precisely why the sharp and unexpected economic blockade of Iran has been initiated, involving all possible entities. However, as mentioned, the chances that anyone will support Trump and fear sanctions are exceedingly low.
It is also worth mentioning Iran's other trading partners. For instance, Turkey is quite a large importer of Iranian goods, while India, conversely, supplies a considerable amount of its products and food to Iran. These countries would also need to sever ties with Tehran to their economic detriment, as Trump desires.
In my view, even if some of Iran's allies indeed cut off all relations with it, this list will be extremely small and will not lead to the severing of all financial arteries. Experts also remind us that Trump often throws around loud threats that are subsequently unsupported by any action. Therefore, in the current situation, we can only wait to see whether Washington will go all-in while holding nothing but twos and threes, or whether it will once again step back.
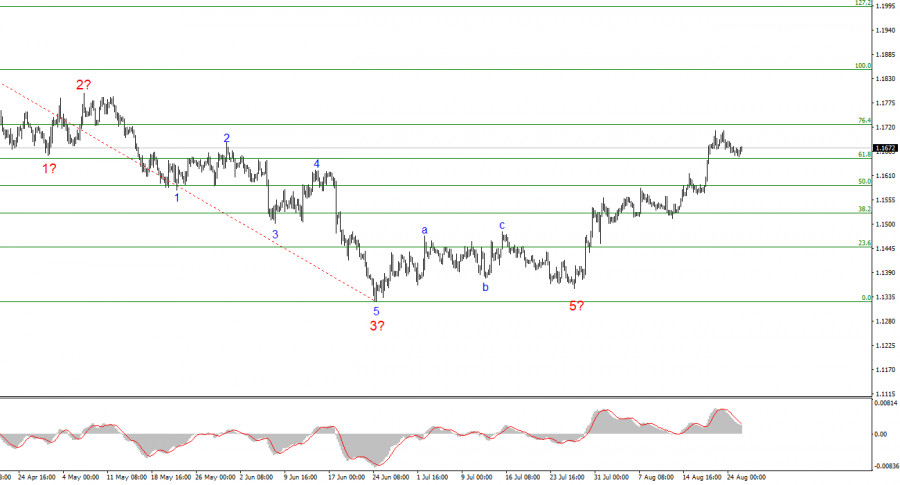
Naturally, all events related to Washington's international politics do not boost confidence in the American currency. Consequently, as long as the White House maintains a protectionist policy, it will be extremely difficult for the dollar to expect growth. In 2026, the U.S.-Iran war served the dollar an invaluable service, but in August it became clear that the market had already priced in this factor, and the dollar began to lose ground again. According to wave analysis, both EUR/USD and GBP/USD have begun developing upward trend segments, so the dollar's decline could be prolonged.
Wave Analysis for EUR/USD:
Based on the analysis of EUR/USD, I conclude that the instrument remains within an upward segment of the trend and, in the shorter term, has presumably transitioned to a new set of upward waves. In my opinion, now is an excellent time to establish long positions. Wave 5 in C has taken a truncated form. If the downward segment of the trend that began on January 28 does not take on a longer, five-wave form (which would require a strong news backdrop in favor of the dollar), the EUR/USD instrument is at the very beginning of a new, long upward trend segment, with targets extending up to the 25 figure.
Wave Analysis for GBP/USD:
The wave picture for the GBP/USD instrument has taken on a completely clear form. We now see a clear corrective structure A-B-C on the charts, which is complete. Therefore, I expect to establish an upward set of waves that take on an impulsive appearance and coincide with the impulsive structure of the EUR/USD instrument. If this is the case, the pound is currently in the third wave, and the targets for the entire trend segment are above the 39 figure. In the coming months, I anticipate trading only to the upside.
Key Principles of My Analysis:
- Wave structures should be simple and understandable. Complex structures are hard to trade as they often carry changes.
- If there is no certainty about what is happening in the market, it's better not to enter.
- There is never 100% certainty in the direction of movement. Do not forget about protective stop-loss orders.
- Wave analysis can be combined with other types of analysis and trading strategies.
GBP/USD – Smart Money Analysis: The Pound Continues to Trade in a Range
25.08.2026
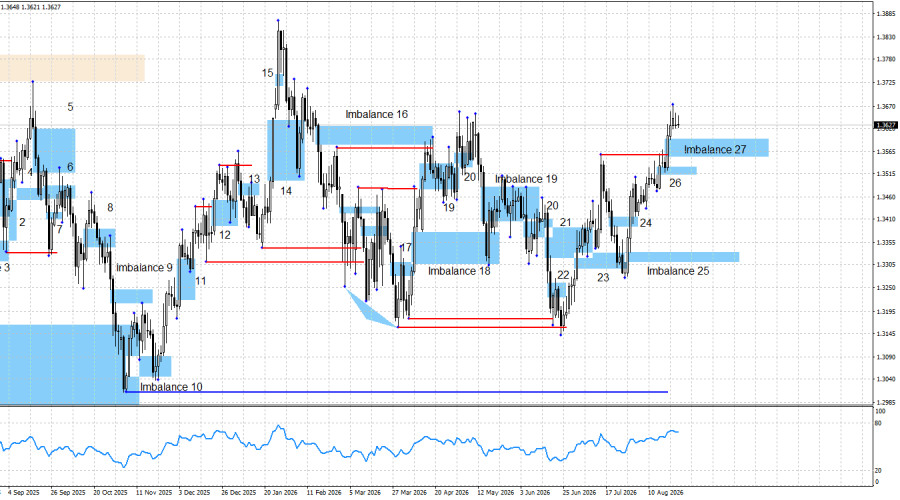
GBP/USD continues to rise, and the move looks entirely justified. As a reminder, the dollar has faced numerous negative factors in recent weeks, including the U.S. Treasury Department's decision to increase purchases of long-term bonds, a weak Nonfarm Payrolls report, a slowdown in the Consumer Price Index, and slower GDP growth. In fact, this is far from a complete list of problems facing the U.S. currency. Therefore, if the dollar continues to decline from current levels, even without a corrective pullback, this would not look unusual. There have been no major news releases this week yet, but tomorrow reports on GDP and durable goods orders will be released. On Friday, the annual Payrolls report and a speech by Kevin Warsh are scheduled. As we can see, there are plenty of risk factors for the dollar. I would prefer the pair to correct toward Imbalance 27 and form a new buy signal, but even such a move may be beyond the bears' capabilities.
Do the bears have any prospects at present? In my view, no. A new buy signal was formed last week, giving traders an opportunity to open new long positions, which are already showing profits of around 100 points. Since June 24, the British pound has formed three buy signals and also provided advance warning of an upcoming markup phase (liquidity sweep). The bears currently have no patterns or signals. For now, they can only rely on a corrective pullback, which could begin after liquidity is taken from the May 1 high. I would also point to the new bullish Imbalance 27, where another buy signal could form. In other words, under the current circumstances, a small corrective pullback would actually be positive, as it could allow traders to enter the market with new positions.
As I have already mentioned, geopolitics is no longer having a positive impact on the dollar, as negotiations between the United States and Iran have effectively stalled. Officially, Tehran is negotiating only with Oman. It remains unclear what these negotiations will lead to in terms of ending the conflict and reopening the Strait of Hormuz. Iran may be able to agree with Oman on conditions for controlling the Strait of Hormuz, but how would that resolve the conflict with the United States and lift the U.S. blockade of the strait? Meanwhile, Donald Trump has decided to impose a second blockade on Iran — a financial one — and to impose sanctions on all countries that support Iran. A new global conflict may be developing, which at best could take the form of a trade or sanctions conflict.
This week, oil is trading slightly above $90 per barrel, but in my view, it will return above $100 in the near future. Today, reports emerged that Donald Trump could lift the economic blockade of Iran if Tehran agrees to lift its blockade of the Strait of Hormuz. However, for now, I regard this information as unconfirmed media speculation. Oil prices declined slightly following the reports, but I do not expect the decline to last.
The chart analysis shows another advance by the bulls. At present, traders have three bullish imbalances (25, 26, and 27) in which long positions can be considered. Naturally, the main focus should be on the latest imbalance, which is also the closest to the current price — Imbalance 27. A liquidity sweep of the May 1 high could trigger a corrective pullback, and this pullback could even extend below Imbalance 27. Therefore, I recommend opening new long positions within Imbalance 27 only after a confirmed signal forms, rather than simply when the price reaches the area of interest. At present, however, the liquidity sweep looks just as unconvincing as the previous one. As a rule, when a liquidity sweep is valid, a sharp move in the opposite direction follows.
The economic news flow on Tuesday was virtually absent, which is clearly reflected in market movements. Only a few reports were released in the United States today, while there were no significant releases in the United Kingdom. The impact of economic data today was negligible.
The overall fundamental backdrop remains such that, in the long term, I see little reason to expect anything other than further dollar weakness. The war between Iran and the United States has not changed this outlook. Geopolitical developments prompted the market to remember the dollar's safe-haven status for several months, but the conflict has already passed its active phase. The chances of FOMC monetary policy tightening have declined significantly in recent weeks, putting pressure on the U.S. currency. Therefore, in my view, any dollar appreciation is temporary and driven by short-term factors. I see no reason for a new bearish advance.
News Calendar for the United States and the United Kingdom:
- United States — Core Personal Consumption Expenditures (PCE) Price Index (12:30 UTC).
- United States — Change in Durable Goods Orders (12:30 UTC).
- United States — Change in Second-Quarter GDP (12:30 UTC).
- United States — Change in Personal Income and Spending (12:30 UTC).
On August 26, the economic calendar contains four releases. The economic backdrop may influence market sentiment during the second half of the day on Wednesday.
GBP/USD Forecast and Trading Recommendations:
The long-term outlook for the pound remains bullish. Following liquidity sweeps of the two most recent swings and the formation of a series of buy signals, the bulls continue to advance. I currently see no basis for a bearish move, as there are no bearish patterns or signals. The bulls received a buy signal from Imbalance 24, which remains valid. Traders may already consider taking profits based on this signal. A new buy signal was formed within Imbalance 26. The current target for the pound is the January 27 high at 1.3867. A liquidity sweep of the May 1 swing could push the pound somewhat lower, but it is unlikely to disrupt the bullish advance. A bullish signal should also be expected to form within Imbalance 27.
The material has been provided by InstaForex Company - www.instaforex.comCryptocurrency Trading Recommendations – August 25 (U.S. Session)
25.08.2026
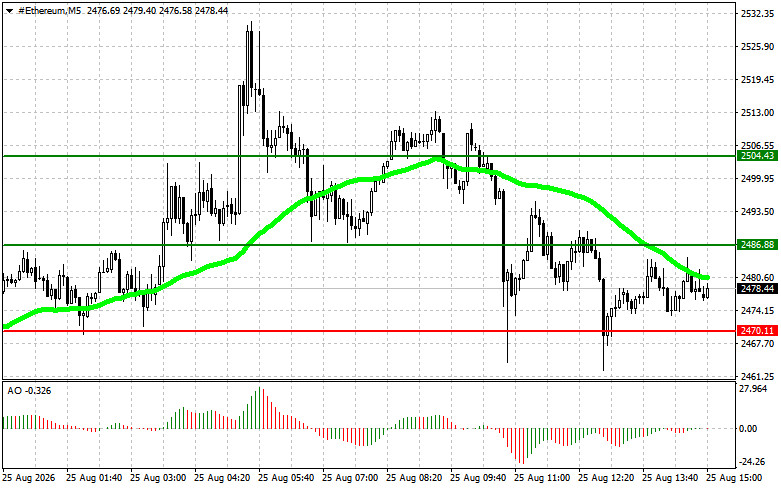
Bitcoin and Ether failed today to make another attempt to reach the monthly high during the European session, after which fairly noticeable profit-taking began. Bitcoin pulled back to $78,700, while Ether fell below $2,500 and is trading at $2,466.

Meanwhile, the Fear and Greed Index remains at 74 points, approaching the extreme greed zone and reaching such levels for the first time since November 2024. Institutional demand continues to confirm the strength of the upward move. Spot Bitcoin ETFs attracted nearly $338 million yesterday, extending a series of inflows that has already produced several consecutive monthly records. An additional boost to the rally came from reports that the Treasury Department is considering using nearly $950 billion from the Treasury General Account to finance further bond buybacks.
However, it is important to understand that the recent sharp rise remains largely the result of a short squeeze rather than solely an improvement in fundamentals, while the next major technical test for the asset is the $88,000–$90,000 resistance level. Despite the impressive rise, Bitcoin remains approximately 36% below its October all-time high of $126,198, meaning that even amid the current euphoria, the path to a full recovery of the cycle remains considerably longer than the distance covered over the past week.
Bitcoin
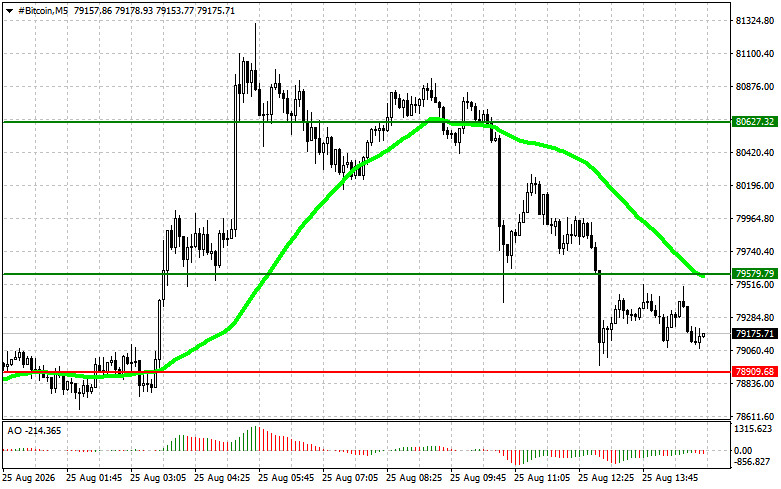
Buying Scenario
Scenario #1: Today, I will buy Bitcoin when the entry point is reached around $79,600, with a target of rising to $80,600. Around $80,600, I will close the long position and sell immediately on a rebound. Before buying on a breakout, it is necessary to make sure that the 50-day moving average is below the current price and that the Awesome Oscillator is above zero.
Scenario #2: Bitcoin can be bought from the lower boundary at $78,900 if there is no market reaction to a breakout below this level, with a return toward $79,600 and $80,600.
Selling Scenario
Scenario #1: Today, I will sell Bitcoin when the entry point is reached around $78,900, with a target of declining to $78,200. Around $78,200, I will close the short position and buy immediately on a rebound. Before selling on a breakout, it is necessary to make sure that the 50-day moving average is above the current price and that the Awesome Oscillator is below zero.
Scenario #2: Bitcoin can be sold from the upper boundary at $79,600 if there is no market reaction to a breakout above this level, with a return toward $78,900 and $78,200.
Ethereum
Buying Scenario
Scenario #1: Today, I will buy Ether when the entry point is reached around $2,486, with a target of rising to $2,504. Around $2,504, I will close the long position and sell immediately on a rebound. Before buying on a breakout, it is necessary to make sure that the 50-day moving average is below the current price and that the Awesome Oscillator is above zero.
Scenario #2: Ether can be bought from the lower boundary at $2,470 if there is no market reaction to a breakout below this level, with a return toward $2,486 and $2,504.
Selling Scenario
Scenario #1: Today, I will sell Ether when the entry point is reached around $2,470, with a target of declining to $2,445. Around $2,445, I will close the short position and buy immediately on a rebound. Before selling on a breakout, it is necessary to make sure that the 50-day moving average is above the current price and that the Awesome Oscillator is below zero.
Scenario #2: Ether can be sold from the upper boundary at $2,486 if there is no market reaction to a breakout above this level, with a return toward $2,470 and $2,445.
The material has been provided by InstaForex Company - www.instaforex.comLevel and Target Adjustments for the U.S. Session – August 25
25.08.2026
The euro and the British pound could be traded quite effectively today using the Mean Reversion strategy. I traded the Japanese yen using Momentum.
The euro rose after Germany released two reports, both of which pointed in the same direction. The Ifo Business Climate Index jumped to 88.8 from 86.7 in July, reaching its highest level in almost a year, with both components increasing simultaneously: the assessment of the current situation rose to 88.5, while expectations increased to 89.1. The Ifo Index is based on surveys of companies and reflects their assessment of current conditions and prospects, so this strong increase strengthened the market's confidence in a recovery of the bloc's largest economy and supported the single currency. The improvement was seen across all four sectors, with the strongest increase in manufacturing, where the balance more than doubled.
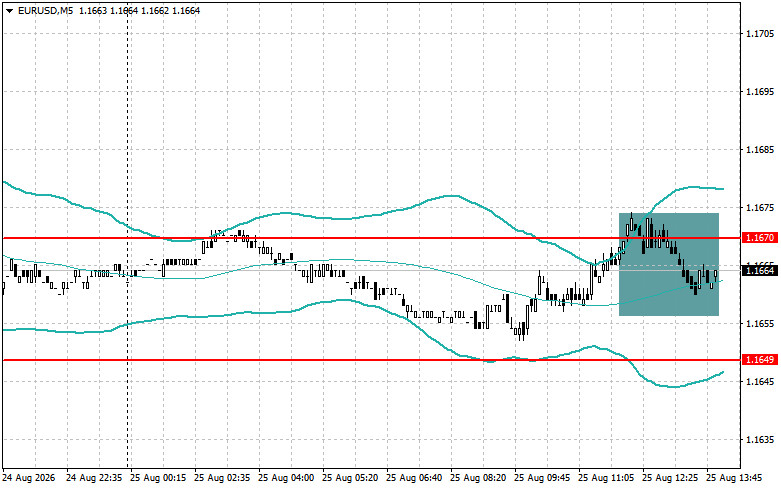
At the same time, Destatis revised second-quarter GDP upward to 0.3% quarter-on-quarter and 1.0% year-on-year, providing an additional positive signal. Nevertheless, the composition of growth is sobering, as the entire contribution came from exports, while investment in machinery and equipment collapsed, consumption increased only marginally, and employment fell by 212,000 people year-on-year, with employment in the services sector declining for the first time since the beginning of the pandemic.
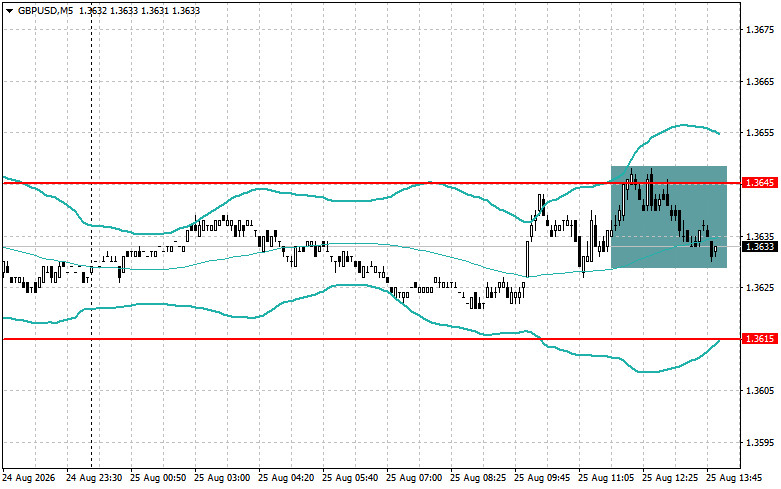
This leaves an economy that is growing on the back of external demand and productivity while losing jobs, and the current optimism among businesses remains more a hope for a turnaround than confirmation that one is underway. This is why the euro's reaction, although positive, was based mainly on improved sentiment, while the actual sustainability of the EUR/USD advance remains questionable.
In the second half of the day, the market is awaiting an equally important batch of U.S. economic data, including the Consumer Confidence Index, new home sales, and the Richmond Fed Manufacturing Index. Consumer confidence reflects Americans' willingness to spend, and since consumption accounts for the largest share of the U.S. economy, this indicator is considered an important gauge. New home sales reflect demand in the interest-rate-sensitive housing sector, while the Richmond Fed Manufacturing Index shows business activity in the region's manufacturing sector.
Strong data could lead to a more substantial rise in the dollar against risk-sensitive assets, as strong figures would strengthen expectations of a tighter Fed policy. This poses a risk of a pullback for the euro and pound, as dollar strength would weigh on EUR/USD and GBP/USD, while weak data would give both European currencies some relief.
If the economic data is strong, I will rely on the Momentum strategy. If the market does not react to the data, I will continue using the Mean Reversion strategy.
Momentum Strategy (Breakout) for the Second Half of the Day:
For EUR/USD
- Buying on a breakout above 1.1670 could lead to a rise in the euro toward 1.1686 and 1.1709.
- Selling on a breakout below 1.1646 could lead to a decline in the euro toward 1.1623 and 1.1601.
For GBP/USD
- Buying on a breakout above 1.3647 could lead to a rise in the pound toward 1.3672 and 1.3707.
- Selling on a breakout below 1.3620 could lead to a decline in the pound toward 1.3594 and 1.3596.
For USD/JPY
- Buying on a breakout above 159.39 could lead to a rise in the dollar toward 159.60 and 159.83.
- Selling on a breakout below 159.13 could lead to a sell-off in the dollar toward 158.83 and 158.57.
Mean Reversion Strategy (Reversion) for the Second Half of the Day:
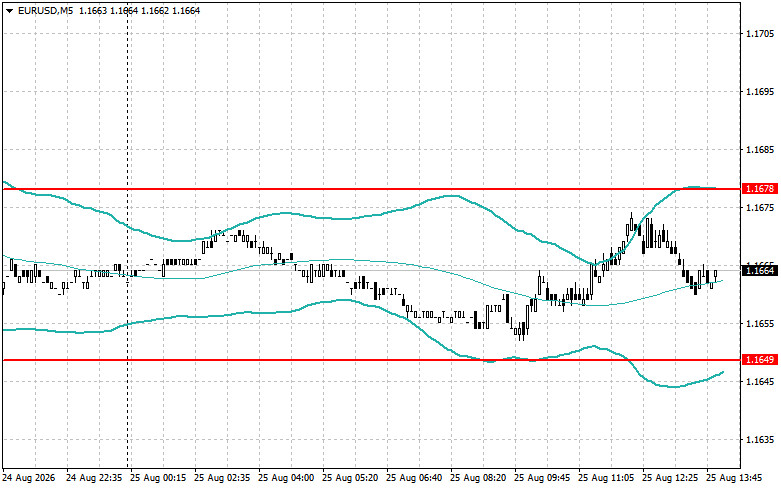
For EUR/USD
- I will look for selling opportunities after a failed breakout above 1.1678, followed by a return below this level.
- I will look for buying opportunities after a failed breakout below 1.1649, followed by a return to this level.
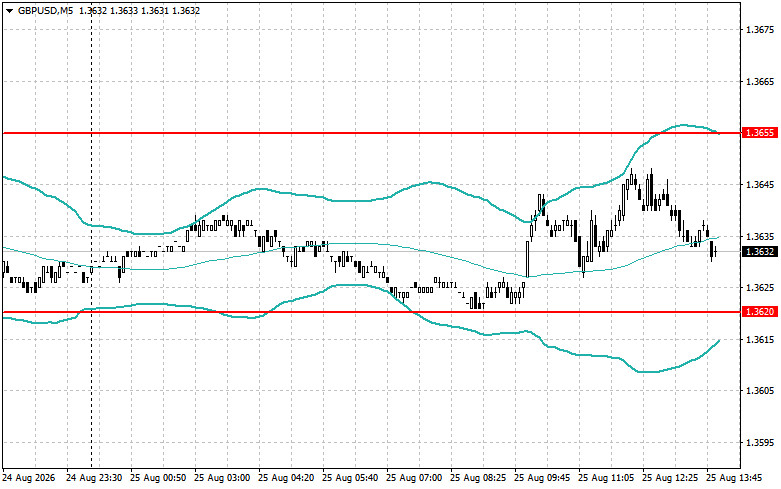
For GBP/USD
- I will look for selling opportunities after a failed breakout above 1.3655, followed by a return below this level.
- I will look for buying opportunities after a failed breakout below 1.3620, followed by a return to this level.
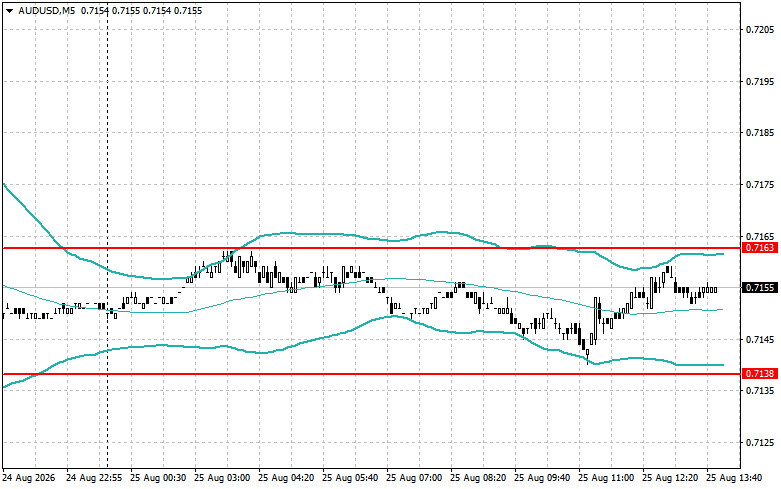
For AUD/USD
- I will look for selling opportunities after a failed breakout above 0.7163, followed by a return below this level.
- I will look for buying opportunities after a failed breakout below 0.7138, followed by a return to this level.
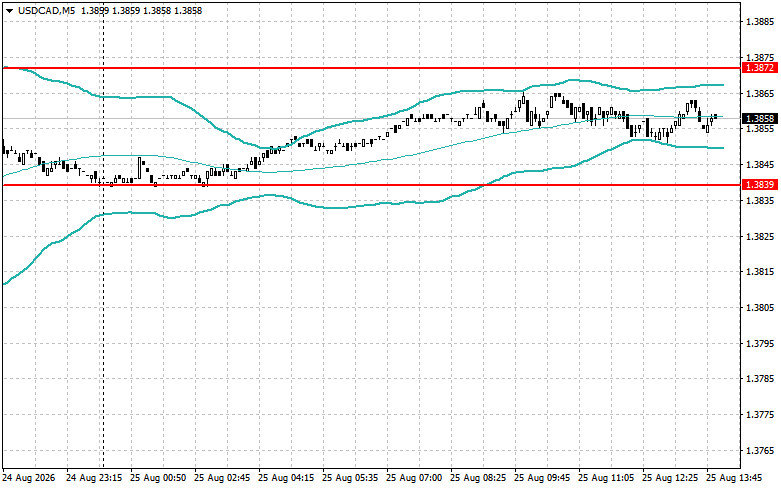
For USD/CAD
- I will look for selling opportunities after a failed breakout above 1.3872, followed by a return below this level.
- I will look for buying opportunities after a failed breakout below 1.3839, followed by a return to this level.
Stock market on August 25: S&P 500 and Nasdaq close mixed
25.08.2026
US equity indexes closed mixed yesterday. The S&P 500 fell 0.28%, the Nasdaq 100 lost 0.76%, and the Dow Jones Industrial Average jumped 0.26%.

Earlier today, futures on US indexes rose as selling pressure on the technology sector eased, pointing to cautious optimism ahead of this week's key earnings that will test confidence in the artificial intelligence market. Nasdaq 100 futures gained 0.4%. The MSCI Asia-Pacific index recovered 0.7% of prior losses and was up 0.3%.
Notably, optimism followed a drop in the Wall Street chipmaker index to its lowest level since July. Nvidia registered its longest run of declines since 2022 as investors trimmed positions ahead of Wednesday's results. In other words, the market partially unloaded in advance, which creates the conditions for a sharp move in either direction once the numbers are released.
A separate theme was bitcoin, which topped $81,000 for the first time since mid-May as optimism returned to the long underperforming crypto market. Recall that in early August the crypto was locked in a $62,000–$66,000 range, and the current rally coincided with dollar weakness after Treasury intervention in the bond market.
Major market shifts are unlikely in the coming days, as investors prepare for Nvidia's earnings to judge whether the AI hardware boom is slowing. Financial markets will also watch Fed chair Kevin Warsh's Jackson Hole appearance closely for clues on the short-term path of monetary policy.
Yesterday, Treasury secretary Scott Bessent unexpectedly refrained from new signals about reforming debt management processes, despite market expectations. During the US session, Treasuries rallied after a report that the Treasury could use cash balances to fund buybacks of higher yielding old paper to reduce borrowing costs, but Bessent did not address the topic in his remarks. The 10-year yield stabilized at 4.71% after a four-basis-point decline earlier in the day.
Currency and commodity markets reacted to the Iran agenda in opposite directions. The dollar retained strength after Bessent's remarks about excluding Iran from the global financial system underscored the greenback's central role in trade and boosted its appeal as a haven.
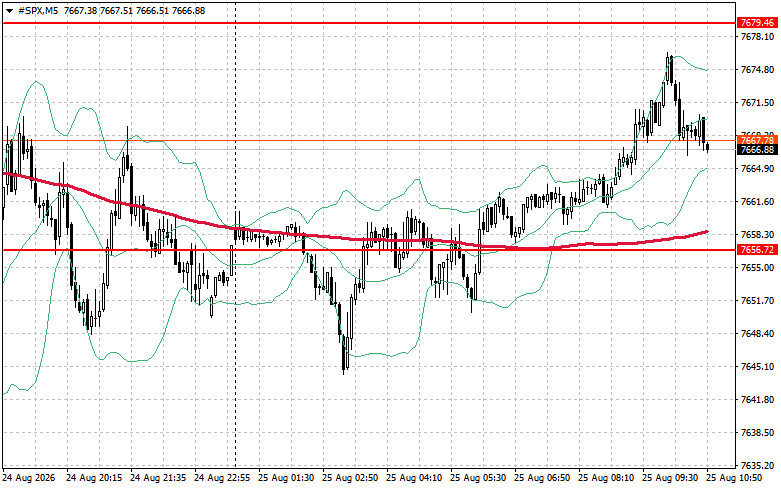
Brent fell 0.8% to about $91.40 per barrel, and gold gave back early gains and eased 0.2% to around $4,640 per ounce, although it had earlier risen to a May high.
According to the technical picture, buyers' immediate task today is to clear resistance at $7,679. That will show strength and open the way to $7,698. Controlling $7,718 would further cement the bulls' position. On the downside, if risk appetite wanes, buyers must defend $7,656. A break there will quickly push the index back to $7,633 and open the road to $7,607.
The material has been provided by InstaForex Company - www.instaforex.comGBP/USD: Trading Tips for Beginner Traders for August 25 (U.S. Session)
25.08.2026
Review of Trades and Trading Tips for the British Pound
The test of 1.3635 occurred when the MACD indicator was just beginning to move upward from the zero line, confirming that this was the correct entry point for buying the pound. As a result, the pair rose by 12 points.
The lack of economic data from the United Kingdom led buyers to attempt to return to the market, but they encountered difficulties almost immediately. Without fresh domestic data, the pound lacks its own fundamental drivers. In their absence, the pair became dependent on the technical picture, where buyers' initiative quickly weakened. The fact that the attempted rise stalled near the middle of the channel suggests that there are currently more sellers willing to sell at the current highs than buyers willing to buy. This balance of forces leaves GBP/USD vulnerable to a further downward correction, as it is difficult for the pound to hold its gains without an influx of fresh demand or a weakening of the dollar.
In the second half of the day, the direction of the pound will be determined by the U.S. economic agenda, as there are no significant domestic catalysts for the British currency. The focus will be on the Consumer Confidence Index, new home sales, and the Richmond Fed Manufacturing Index. Consumer confidence reflects Americans' sentiment toward the economy, new home sales indicate demand in the interest-rate-sensitive housing sector, while the Richmond Fed Manufacturing Index provides insight into manufacturing activity in the region. Through these channels, the data affects the strength of the dollar. Strong figures could lead to a more substantial rise in the dollar against risk-sensitive assets, putting pressure on GBP/USD, while weak data would support the British currency through a weaker U.S. dollar.
As for the intraday strategy, I will rely primarily on the implementation of Scenarios #1 and #2.
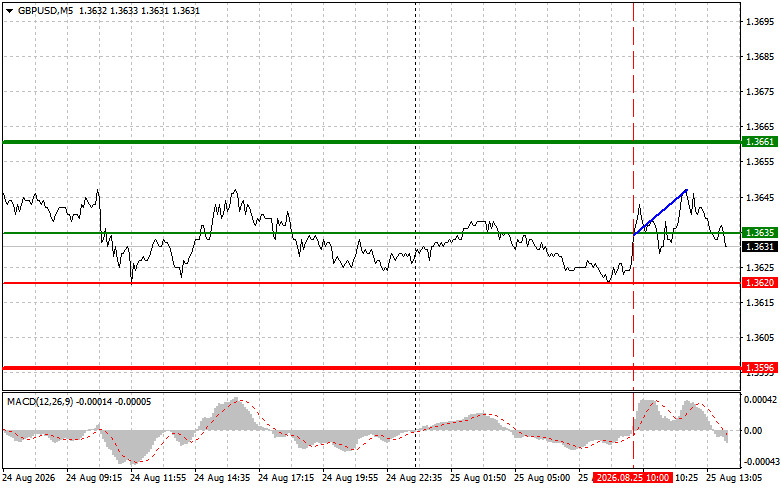
Buy Signal
Scenario #1: Today, I plan to buy the pound when the entry point is reached around 1.3639 (the green line on the chart), with a target of rising to 1.3661 (the thicker green line on the chart). Around 1.3661, I will close the long position and open a short position, targeting a move of 30–35 points in the opposite direction from the level. Further gains in the pound as part of the prevailing trend can be expected today only if U.S. data is weak. Important: Before buying, make sure that the MACD indicator is above the zero line and is just beginning to rise from it.
Scenario #2: Today, I also plan to buy the pound if the price tests 1.3627 twice consecutively while the MACD indicator is in the oversold zone. This would limit the pair's downward potential and lead to a reversal higher. A rise toward the opposite levels of 1.3639 and 1.3661 can be expected.
Sell Signal
Scenario #1: Today, I plan to sell the pound after the 1.3627 level is broken (the red line on the chart), which should lead to a rapid decline in the pair. The key target for sellers will be 1.3608, where I will close the short position and immediately open a long position in the opposite direction, targeting a move of 20–25 points in the opposite direction from the level. Strong pressure on the pound is expected to return if U.S. data is strong. Important: Before selling, make sure that the MACD indicator is below the zero line and is just beginning to decline from it.
Scenario #2: Today, I also plan to sell the pound if the price tests 1.3639 twice consecutively while the MACD indicator is in the overbought zone. This would limit the pair's upward potential and lead to a reversal lower. A decline toward the opposite levels of 1.3627 and 1.3608 can be expected.
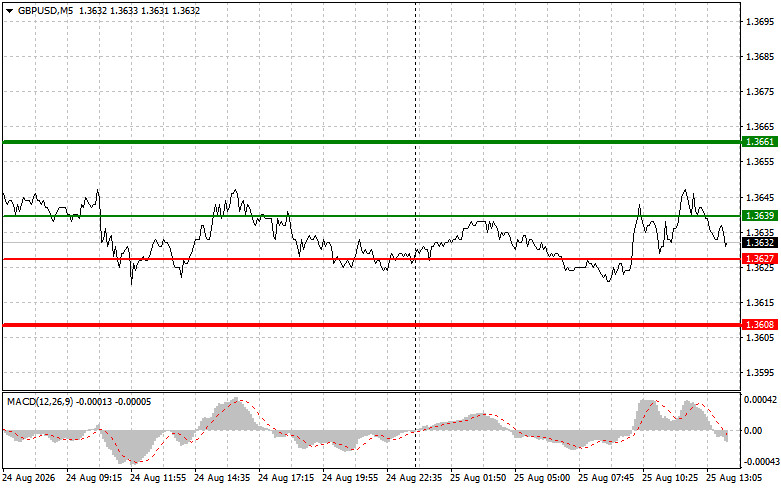
What the Chart Shows:
- Thin green line — the entry price at which the trading instrument can be bought;
- Thick green line — the estimated price at which Take Profit orders can be placed or profits can be taken manually, as further gains above this level are unlikely;
- Thin red line — the entry price at which the trading instrument can be sold;
- Thick red line — the estimated price at which Take Profit orders can be placed or profits can be taken manually, as further declines below this level are unlikely;
- MACD indicator. When entering the market, it is important to take the overbought and oversold zones into account.
Important. Beginner Forex traders should exercise extreme caution when making market-entry decisions. Before the release of important fundamental reports, it is best to stay out of the market to avoid being caught in sharp price fluctuations. If you decide to trade during a news release, always place stop orders to minimize losses. Without stop orders, you can lose your entire deposit very quickly, especially if you do not use proper money management and trade large volumes.
And remember that successful trading requires a clear trading plan, such as the one presented above. Making trading decisions spontaneously based on the current market situation is fundamentally a losing strategy for an intraday trader.
The material has been provided by InstaForex Company - www.instaforex.comUSD/JPY: Trading Tips for Beginner Traders – August 25 (U.S. Session)
25.08.2026
Review of Trades and Trading Tips for the Japanese Yen
The test of 159.43 occurred when the MACD indicator had already risen significantly above the zero line, which limited the pair's upward potential. The second test of 159.43, while the MACD was in the overbought zone, led to the implementation of Scenario #2 for selling the dollar, resulting in a 20-point decline in the pair.
In the second half of the day, the market is awaiting a batch of U.S. economic data, including the Consumer Confidence Index, new home sales, and the Richmond Fed Manufacturing Index. These indicators provide additional insight into the state of the economy, and strong figures could lead to a more substantial rise in the dollar due to increased expectations for the Fed's interest rate and higher U.S. Treasury yields. In the event of strong data, the Japanese yen risks coming under pressure, as a stronger dollar would widen the divergence between the Fed's approach and the much more cautious stance of the Bank of Japan. USD/JPY could move higher, while a weak result would allow the yen to recover some of its losses.
As for the intraday strategy, I will rely primarily on the implementation of Scenarios #1 and #2.
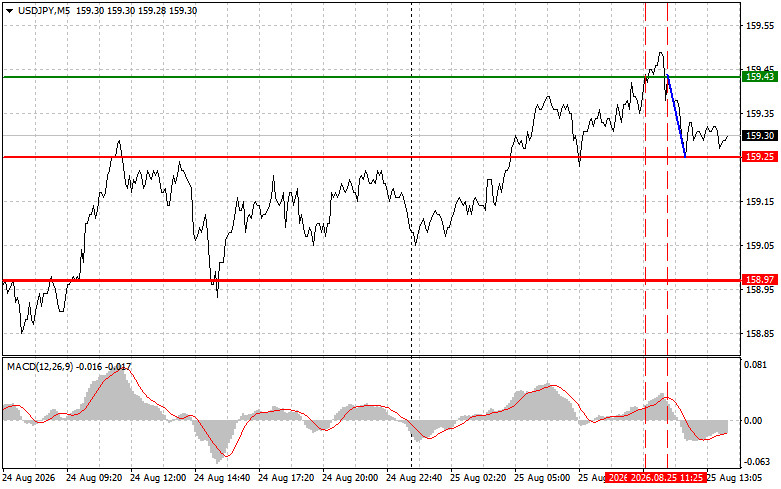
Buy Signal
Scenario #1: Today, I plan to buy USD/JPY when the entry point is reached around 159.43 (the green line on the chart), with a target of rising to 159.72 (the thicker green line on the chart). Around 159.72, I will close the long position and open a short position, targeting a move of 30–35 points in the opposite direction from the level. A rise in the pair can be expected today, but the outlook is rather uncertain. Important: Before buying, make sure that the MACD indicator is above the zero line and is just beginning to rise from it.
Scenario #2: Today, I also plan to buy USD/JPY if the price tests 159.25 twice consecutively while the MACD indicator is in the oversold zone. This would limit the pair's downward potential and lead to a reversal higher. A rise toward the opposite levels of 159.43 and 159.72 can be expected.
Sell Signal
Scenario #1: Today, I plan to sell USD/JPY after the price breaks below 159.25 (the red line on the chart), which should lead to a rapid decline in the pair. The key target for sellers will be 158.97, where I will close the short position and immediately open a long position, targeting a move of 20–25 points in the opposite direction from the level. Pressure on the pair is expected to return if the central bank intervenes. Important: Before selling, make sure that the MACD indicator is below the zero line and is just beginning to decline from it.
Scenario #2: Today, I also plan to sell USD/JPY if the price tests 159.43 twice consecutively while the MACD indicator is in the overbought zone. This would limit the pair's upward potential and lead to a reversal lower. A decline toward the opposite levels of 159.25 and 158.97 can be expected.
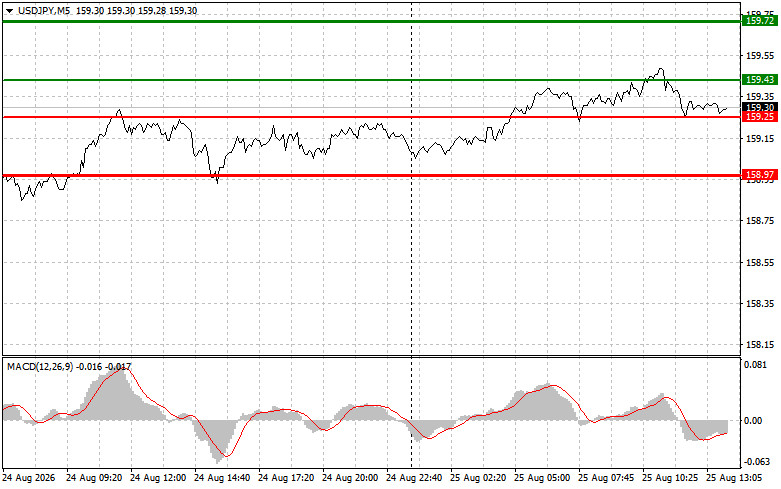
What the Chart Shows:
- Thin green line — the entry price at which the trading instrument can be bought;
- Thick green line — the estimated price at which Take Profit orders can be placed or profits can be taken manually, as further gains above this level are unlikely;
- Thin red line — the entry price at which the trading instrument can be sold;
- Thick red line — the estimated price at which Take Profit orders can be placed or profits can be taken manually, as further declines below this level are unlikely;
- MACD indicator. When entering the market, it is important to take the overbought and oversold zones into account.
Important. Beginner Forex traders should exercise extreme caution when making market-entry decisions. Before the release of important fundamental reports, it is best to stay out of the market to avoid being caught in sharp price fluctuations. If you decide to trade during a news release, always place stop orders to minimize losses. Without stop orders, you can lose your entire deposit very quickly, especially if you do not use proper money management and trade large volumes.
And remember that successful trading requires a clear trading plan, such as the one presented above. Making trading decisions spontaneously based on the current market situation is fundamentally a losing strategy for an intraday trader.
The material has been provided by InstaForex Company - www.instaforex.comGBP/USD – Price Analysis and Forecast: The Pair Remains Without Significant Momentum for the Second Consecutive Day
25.08.2026
Today, Tuesday, GBP/USD continues to move sideways in consolidation, trading below the 1.3660 level. The U.S. dollar is targeting a continuation of its moderate recovery after reaching its lowest levels since May 14, putting pressure on the currency pair. Nevertheless, the absence of further selling in GBP/USD signals to traders that the pair is consolidating.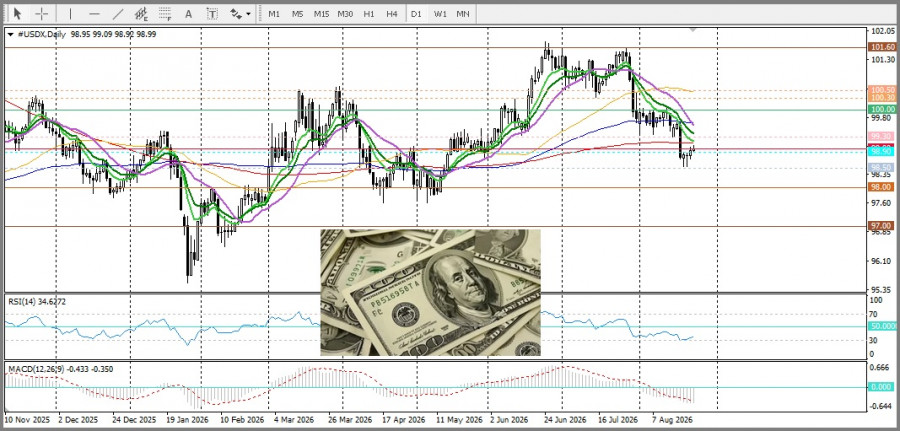 Moderate U.S. inflation data for July changed market expectations, suggesting that monetary policy will be left unchanged at the upcoming FOMC meeting on September 15–16. However, traders still assess the probability of the Federal Reserve (Fed) raising interest rates at least once before the end of the year at more than 75%, given inflation risks associated with fluctuations in oil prices. In addition, rising tensions between the United States and Iran are supporting the dollar as a safe-haven asset and limiting gains in GBP/USD.
Against the backdrop of the Middle East crisis, Treasury Secretary Scott Bessent said on Monday that the United States was launching a campaign to economically isolate Iran, warning that any country doing business with Iran would risk facing U.S. sanctions. In response to these statements, Mohsen Rezaei, Secretary of Iran's Supreme National Security Council, said that the Islamic Republic would completely halt oil exports through the Strait of Hormuz if the economic war continued.
Nevertheless, traders remain cautious and are avoiding aggressive bullish positions on the U.S. dollar, preferring to wait for additional signals regarding the Fed's future monetary policy. In this regard, attention should be paid to Wednesday's release of the Personal Consumption Expenditures (PCE) Price Index, as well as Fed Chair Kevin Warsh's speech at the annual symposium in Jackson Hole on Friday. These developments could have a significant impact on the dollar's exchange rate and provide new momentum for GBP/USD.
From a technical perspective, GBP/USD maintains a positive short-term trend, trading above the 200-day simple moving average (SMA). However, confirmation of the positive trend and further gains requires a breakout of the resistance level at 1.3660–1.3667, the monthly high. The nearest support is at 1.3618, followed by the round-number level of 1.3600. The oscillators are positive, confirming the bulls' advantage in the market. Meanwhile, the Relative Strength Index (RSI) is close to the overbought zone, indicating bullish consolidation.
The table below shows the percentage change in the U.S. dollar against major currencies this week, with the dollar showing its greatest strength against the Japanese yen.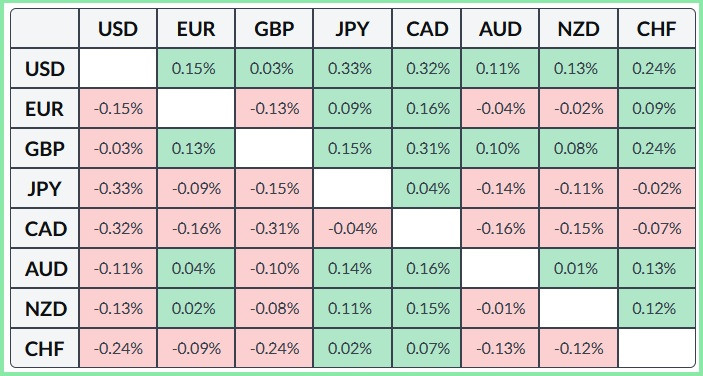
GBP/USD – August 25: Traders Are Waiting for Clearer Market Signals
25.08.2026
On the hourly chart, GBP/USD continued to trade near the 1.3633–1.3641 level on Monday. After three days, it is difficult to say what traders are planning to do next. There has been no clear consolidation either above or below the indicated zone. Thus, the market has reached a state of complete equilibrium, and for now neither the bulls nor the bears are ready to disrupt it.
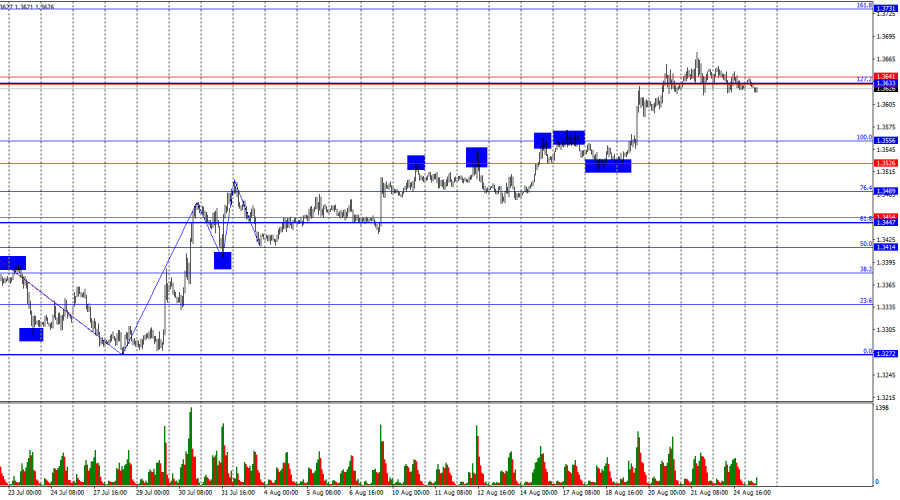
The market situation remains "bullish." The latest completed downward wave did not break the previous low, while the latest upward wave (which is not yet complete) broke the previous high. Thus, the bulls currently have the initiative in the market, and their advantage is strengthening with each passing day. The "bullish" trend can be considered broken only after the low of the latest completed wave is broken, i.e. below 1.3414, or after two downward waves are formed.
There was no significant fundamental backdrop on Monday, so the market continues to take a break after the weekend. In general, no one wants to take risks right now, as no one understands how events will unfold from here. Kevin Warsh is scheduled to speak this Friday, and what position will he take this time? Based on the latest economic data on the labor market and inflation, it is extremely unlikely that the Fed will decide to tighten monetary policy in September. It remains unclear how events in the Middle East will develop, while these very events will affect oil prices, inflation, and monetary policy. Thus, the best course of action for traders now is to wait for news and respond to developments in the world as they unfold. We can see that there have been no interesting market movements at the beginning of the week, so all that remains is to wait. Perhaps even for a long time. Today marks the beginning of the final phase of Donald Trump's operation to disarm Iran, which has already lasted six months. Trump now wants to destroy Iran economically, while traders still have little understanding of what this will look like in practice. The U.S. president is calling on all countries to stop cooperating with Tehran, but it is also unclear whether anyone will heed the U.S. president's calls.
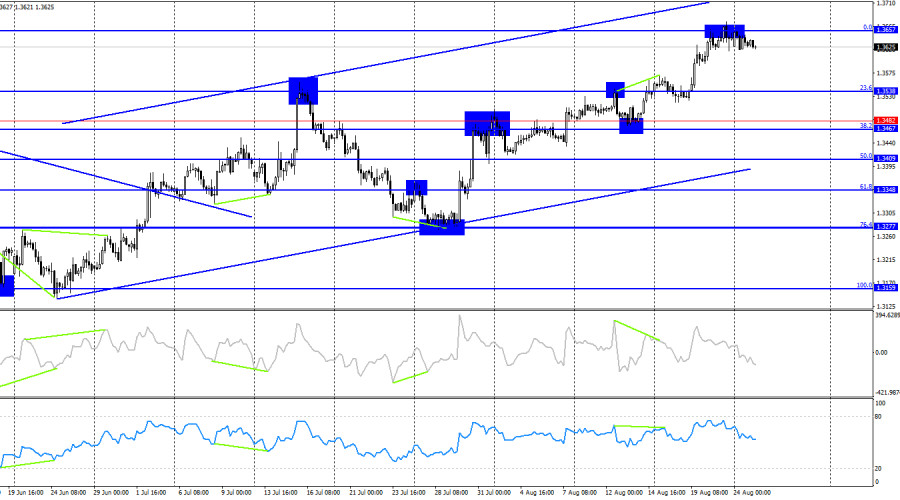
On the 4-hour chart, GBP/USD rose to the 0.0% retracement level at 1.3657. A rebound from this level would favor the U.S. dollar and some decline toward the 23.6% Fibonacci level at 1.3538. Consolidation above 1.3657 would increase the chances of further gains for the pound. No new emerging divergences are currently observed on any of the indicators.
Commitments of Traders (COT) Report:
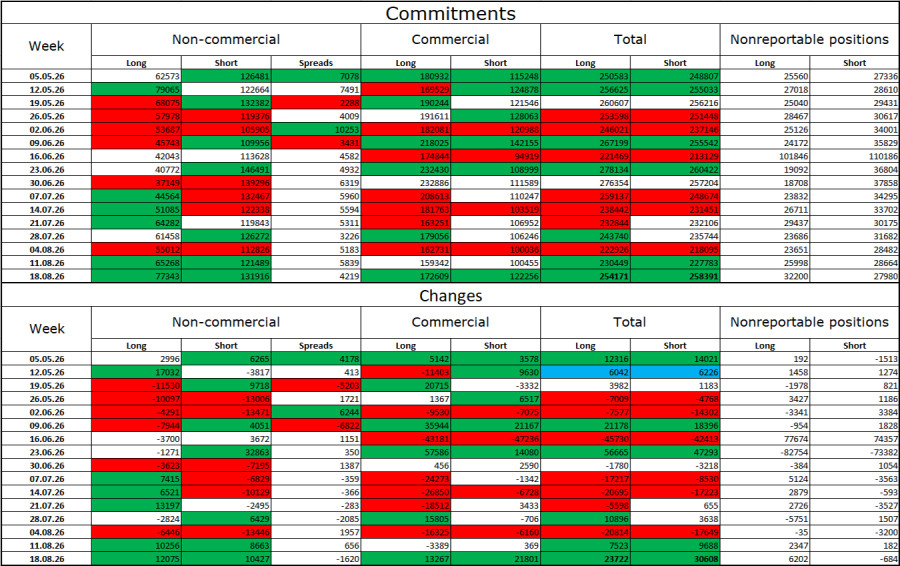
The sentiment of the "Non-commercial" trader category became slightly less "bearish" over the latest reporting week. The number of Long positions held by speculators increased by 12,075, while the number of Short positions increased by 10,427. The gap between the number of Long and Short positions is currently essentially as follows: 77,000 versus 132,000. The gap and the bears' advantage are gradually narrowing, but the bears' advantage nevertheless remains enormous. Previously, the bears' dominance raised no questions, but now it does, as the fundamental backdrop has changed.
I still do not believe in a "bearish" trend for the pound, but in the near future everything will depend on Trump's trade policy, the monetary policies of the Fed and the Bank of England, as well as the duration, scale, and consequences of the war in the Middle East. In recent months, the market has adjusted its expectations toward peace, but negotiations between Iran and the United States failed without really getting started. And there is no guarantee that they will resume in the near future. Meanwhile, FOMC monetary policy is shifting toward abandoning further tightening, which does not add optimism for dollar bulls.
News Calendar for the United States and the United Kingdom:
- U.S. – Weekly ADP employment report (12:15 UTC).
- U.S. – CP Consumer Confidence Index (14:00 UTC).
- U.S. – New Home Sales (14:00 UTC).
On August 25, the economic calendar contains three entries and not a single important one. The impact of the economic backdrop on market sentiment on Tuesday will be extremely weak or nonexistent.
GBP/USD Forecast and Trading Tips:
Selling the pair is possible today if there is consolidation below the 1.3633–1.3641 level on the hourly chart, with a target of 1.3556. Buying is possible if there is consolidation above the 1.3633–1.3641 level, with a target of 1.3731. However, the past few days should be taken into account, as they have not produced any signals.
The Fibonacci level grids are drawn from 1.3557–1.3272 on the hourly chart and from 1.3158–1.3655 on the 4-hour chart.
The material has been provided by InstaForex Company - www.instaforex.comWe re-designed, to let you stay FOCUSED and relaxed (no ads) while you TRADE (no distractions). If you like our website, you can support us by hitting any button below!